Stock connect
1. Function entrance
1.1 App
By clicking "Quotes-Markets-Stock Connect", you can enter the detail page:
Click on a single section on the "Stock Connect" page, or search for the section name code to enter the section detail page.

1.2 Desktop
Click "Markets-Stock Connect" to view all data
2. Function introduction
2.1 Capital Flow Trend
2.1.1 This module displays the flow of funds in the four cyclical dimensions of HK->SH Connect, HK->SZ Connect, SH->HK Connect and SZ->HK Connect, as well as the index closing price curve related to the sector.
2.1.2 Chart that can be switched between different periodic dimensions, a total of four periodic dimensions: today, Historical Daily, Historical Weekly, Historical Monthly
2.1.3 (desktop support only) can hide the trend chart of the corresponding plate or index
2.1.4 long press the chart area to view the specific data of a single point; drag the chart left or right to view historical data.
2.2 Today's quota
This module displays data on the net flow of funds, total amount, and used percentage of HK->SH Connect, HK->SZ Connect, SH->HK Connect and SZ->HK Connect.
2.3 Cumulative net flow of funds
This module displays the accumulated net capital flow of each sector for a period of time. The time is calculated on the basis of trading days, that is, "last 5 days" means the last 5 trading days.
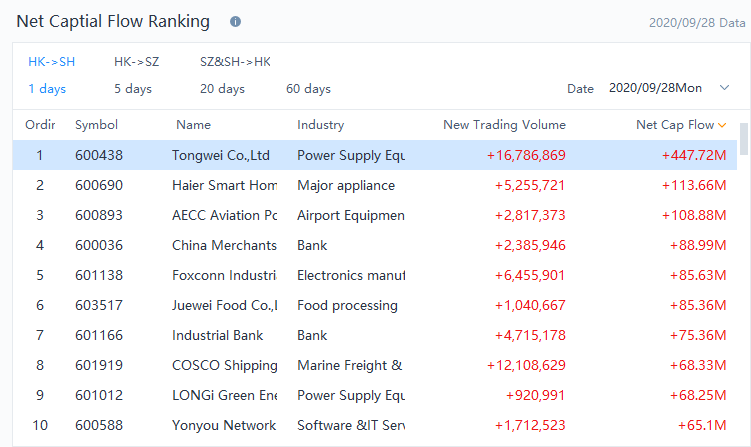
2.4 Net Capital Flow Ranking


This module displays the net number of shares purchased and sold through the north-south channel and the amount of capital flow of each sector's constituent stocks.
Special circumstances:
1) As the constituent stocks of Southbound Trading do not distinguish between the flow of funds in the Shanghai and Shenzhen markets, the Southbound Trading only has one point of the list of capital flows in North Water.
2) Data update time:
i. Due to the T+2 day settlement rule of the Hong Kong Stock Exchange, only the transaction data of the first two trading days on the day of Southbound Trading;
ii. Due to the T+1-day settlement rules of the Shanghai Stock Exchange and the Shenzhen Stock Exchange, the Shanghai Stock Connect and Shenzhen Stock Connect only have transaction data on the previous trading day.
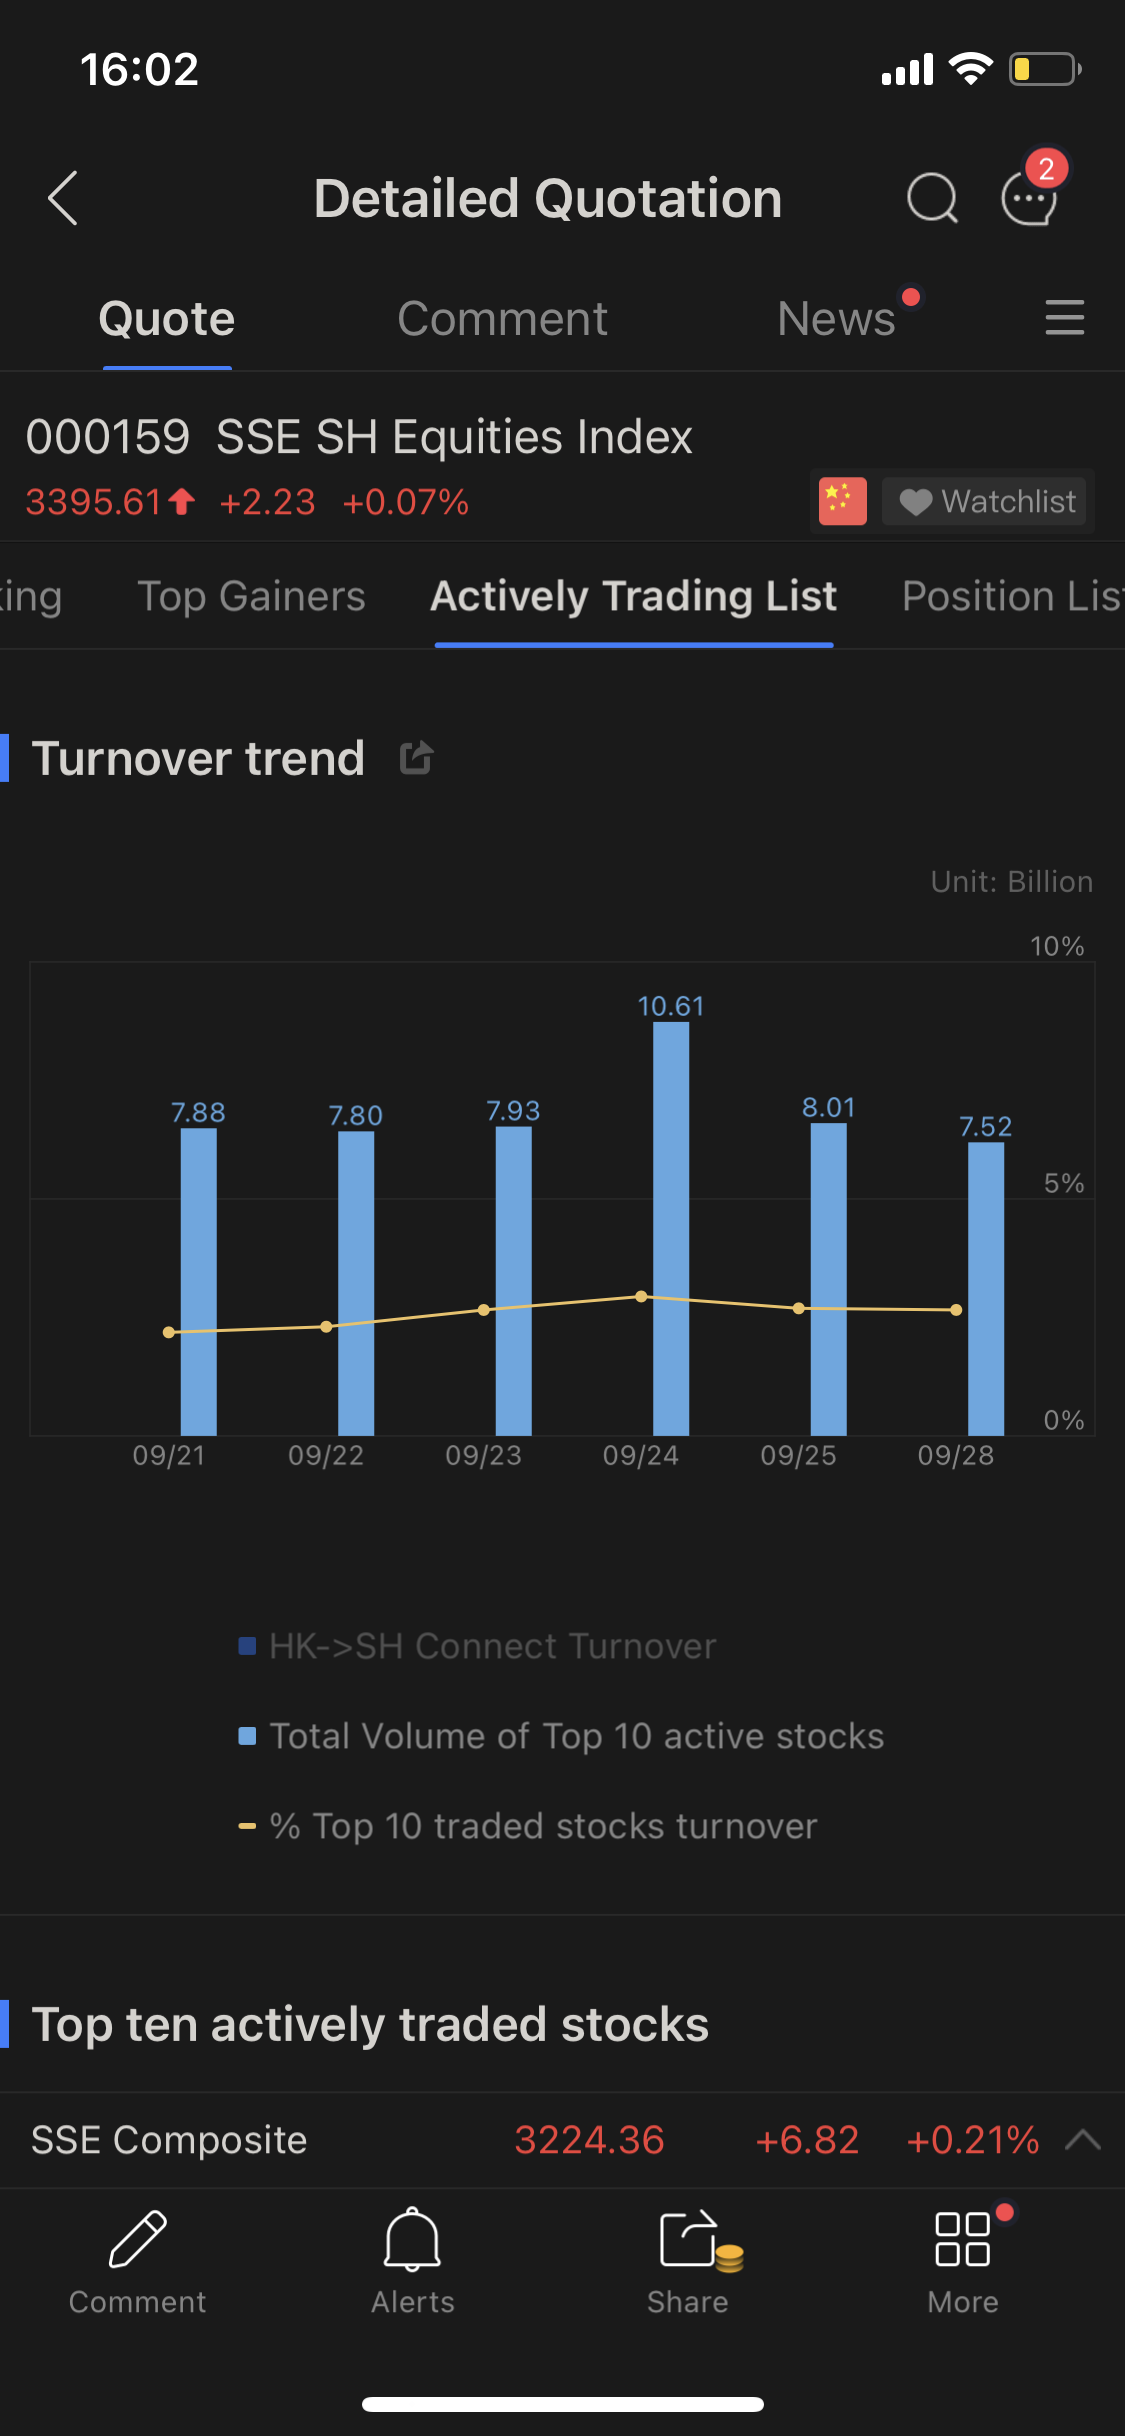
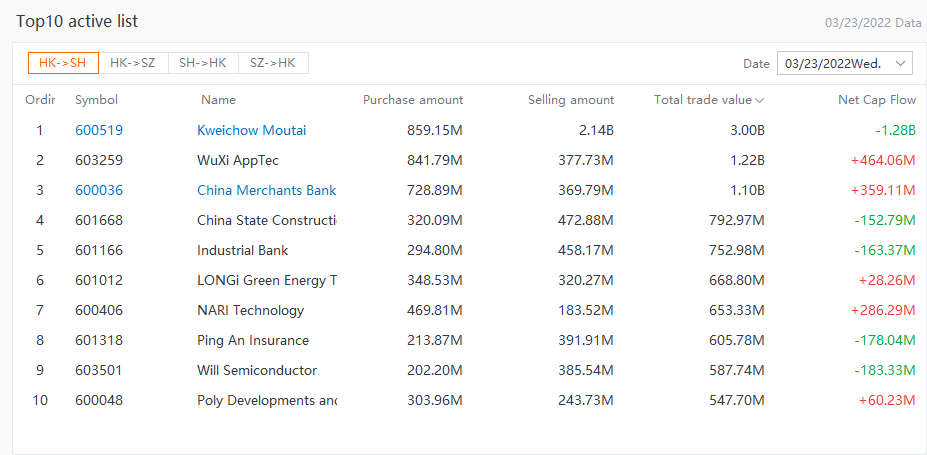
2.5 Actively Trading List


This module displays the ten most active stocks in North and South Water trading on the designated trading day of each sector;
Due to exchange disclosure restrictions, the latest data is only for the T-1 day.
Risk Disclosure This presentation is for informational and educational use only and is not a recommendation or endorsement of any particular investment or investment strategy. Investment information provided in this content is general in nature, strictly for illustrative purposes, and may not be appropriate for all investors. It is provided without respect to individual investors’ financial sophistication, financial situation, investment objectives, investing time horizon, or risk tolerance. You should consider the appropriateness of this information having regard to your relevant personal circumstances before making any investment decisions. Past investment performance does not indicate or guarantee future success. Returns will vary, and all investments carry risks, including loss of principal. Moomoo makes no representation or warranty as to its adequacy, completeness, accuracy or timeliness for any particular purpose of the above content.