Institutional Tracker
1. Navigation
• Mobile: Tap Markets > US > Institutional Tracker
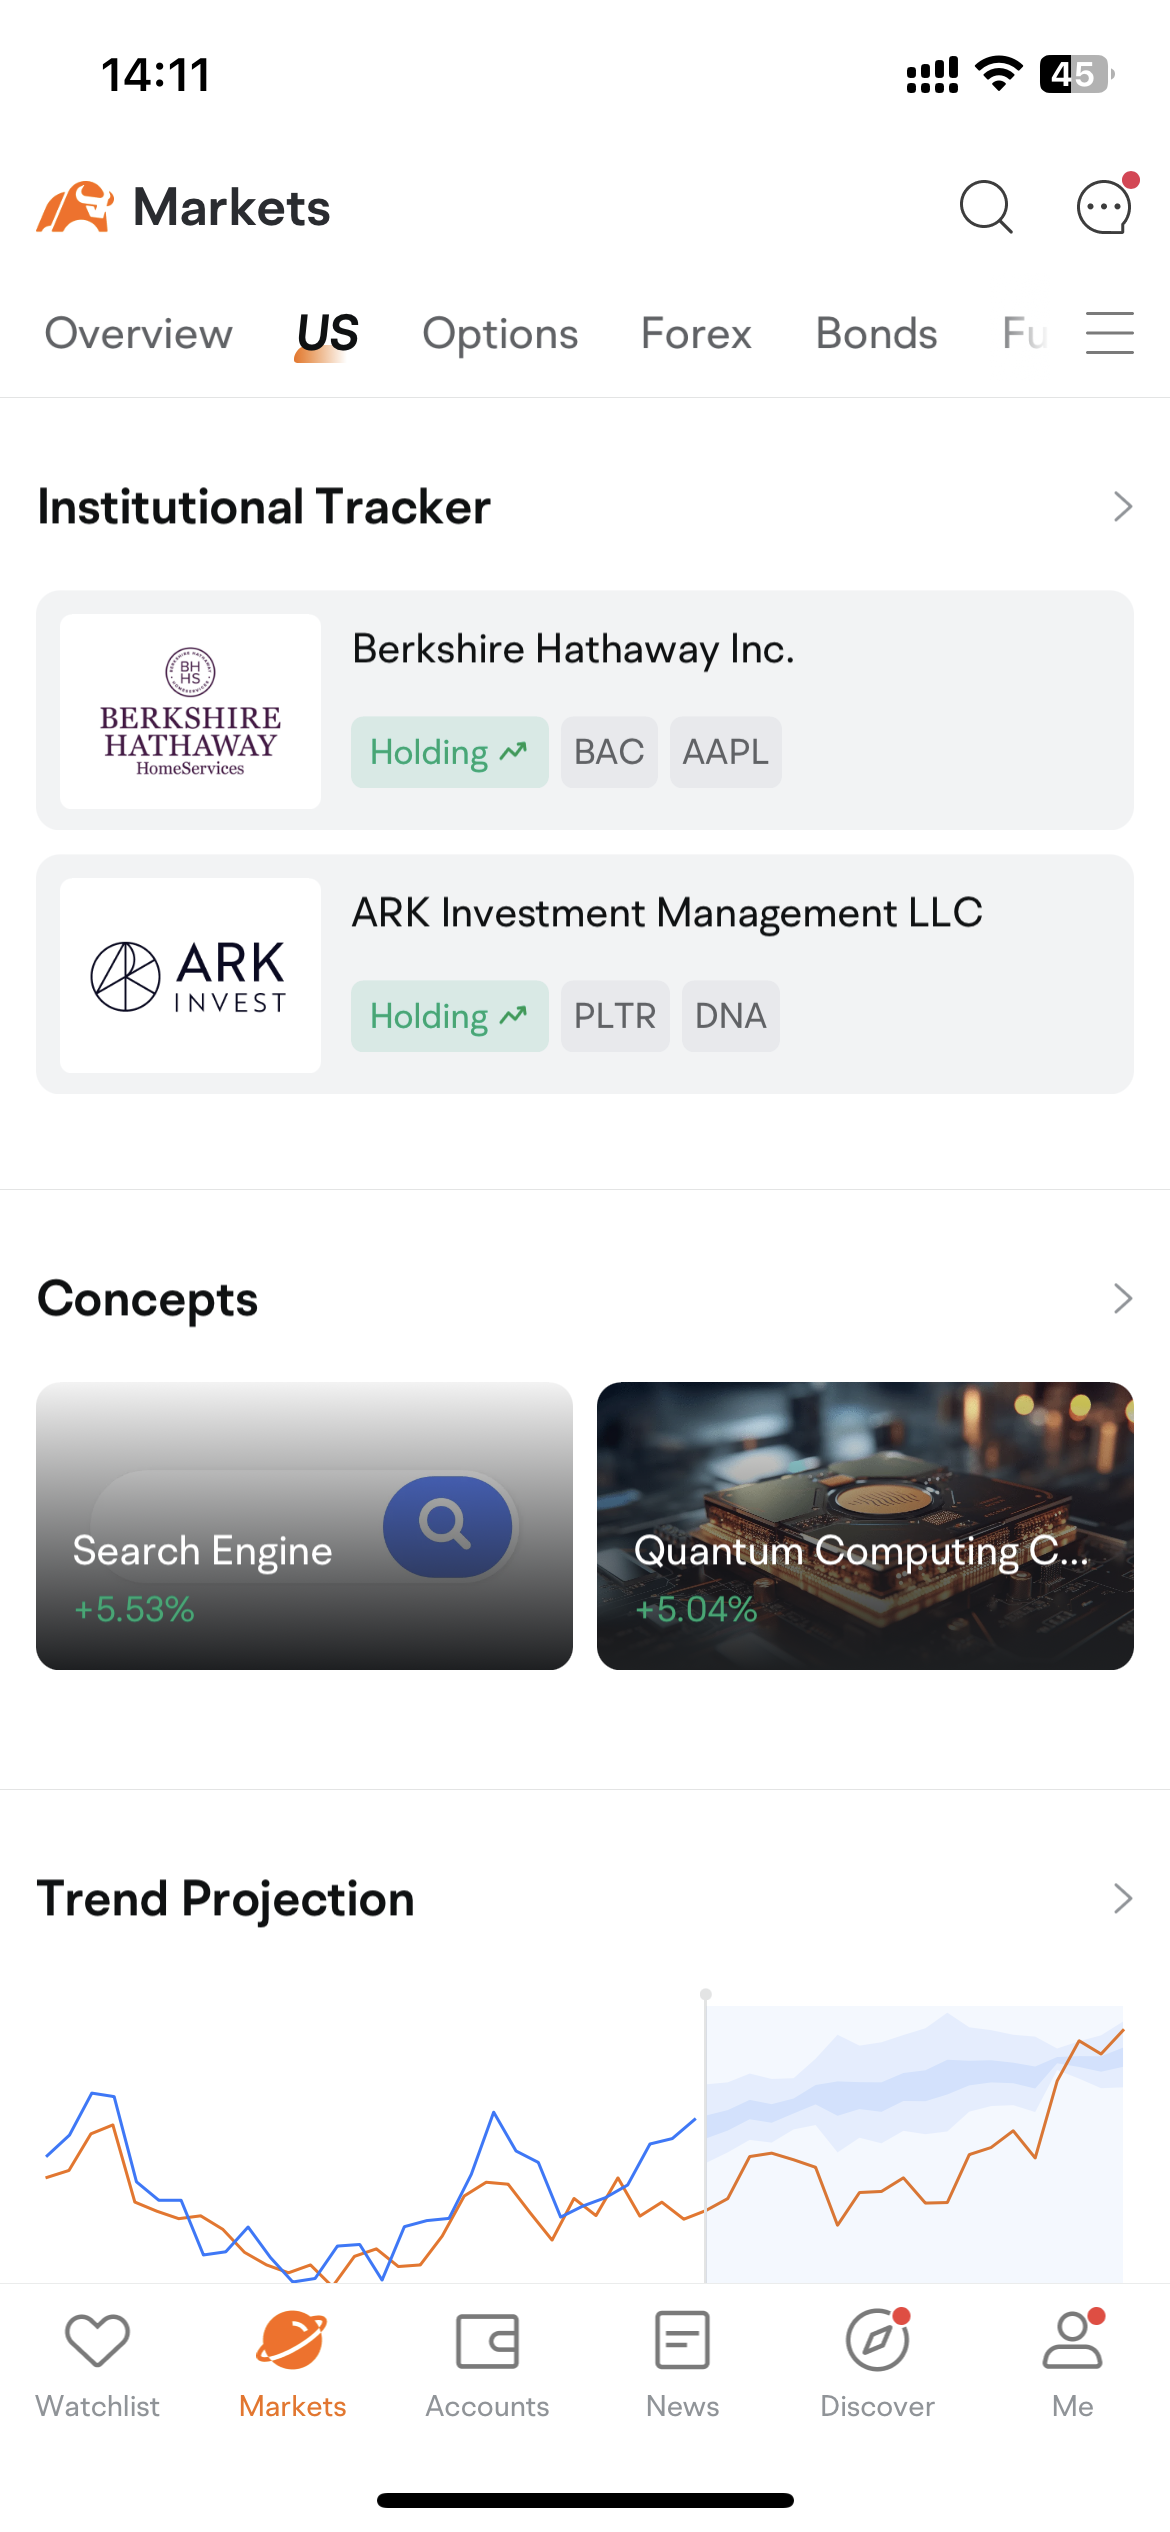
(Please note that the application interface and its content shown above may differ from the actual application interface and content. To avoid any discrepancies, please update the application to the latest version available. The securities mentioned in the screenshot are for illustrative purposes only and should not be construed as investment advice.)
• Desktop: Click on Explore > Institutional Holdings
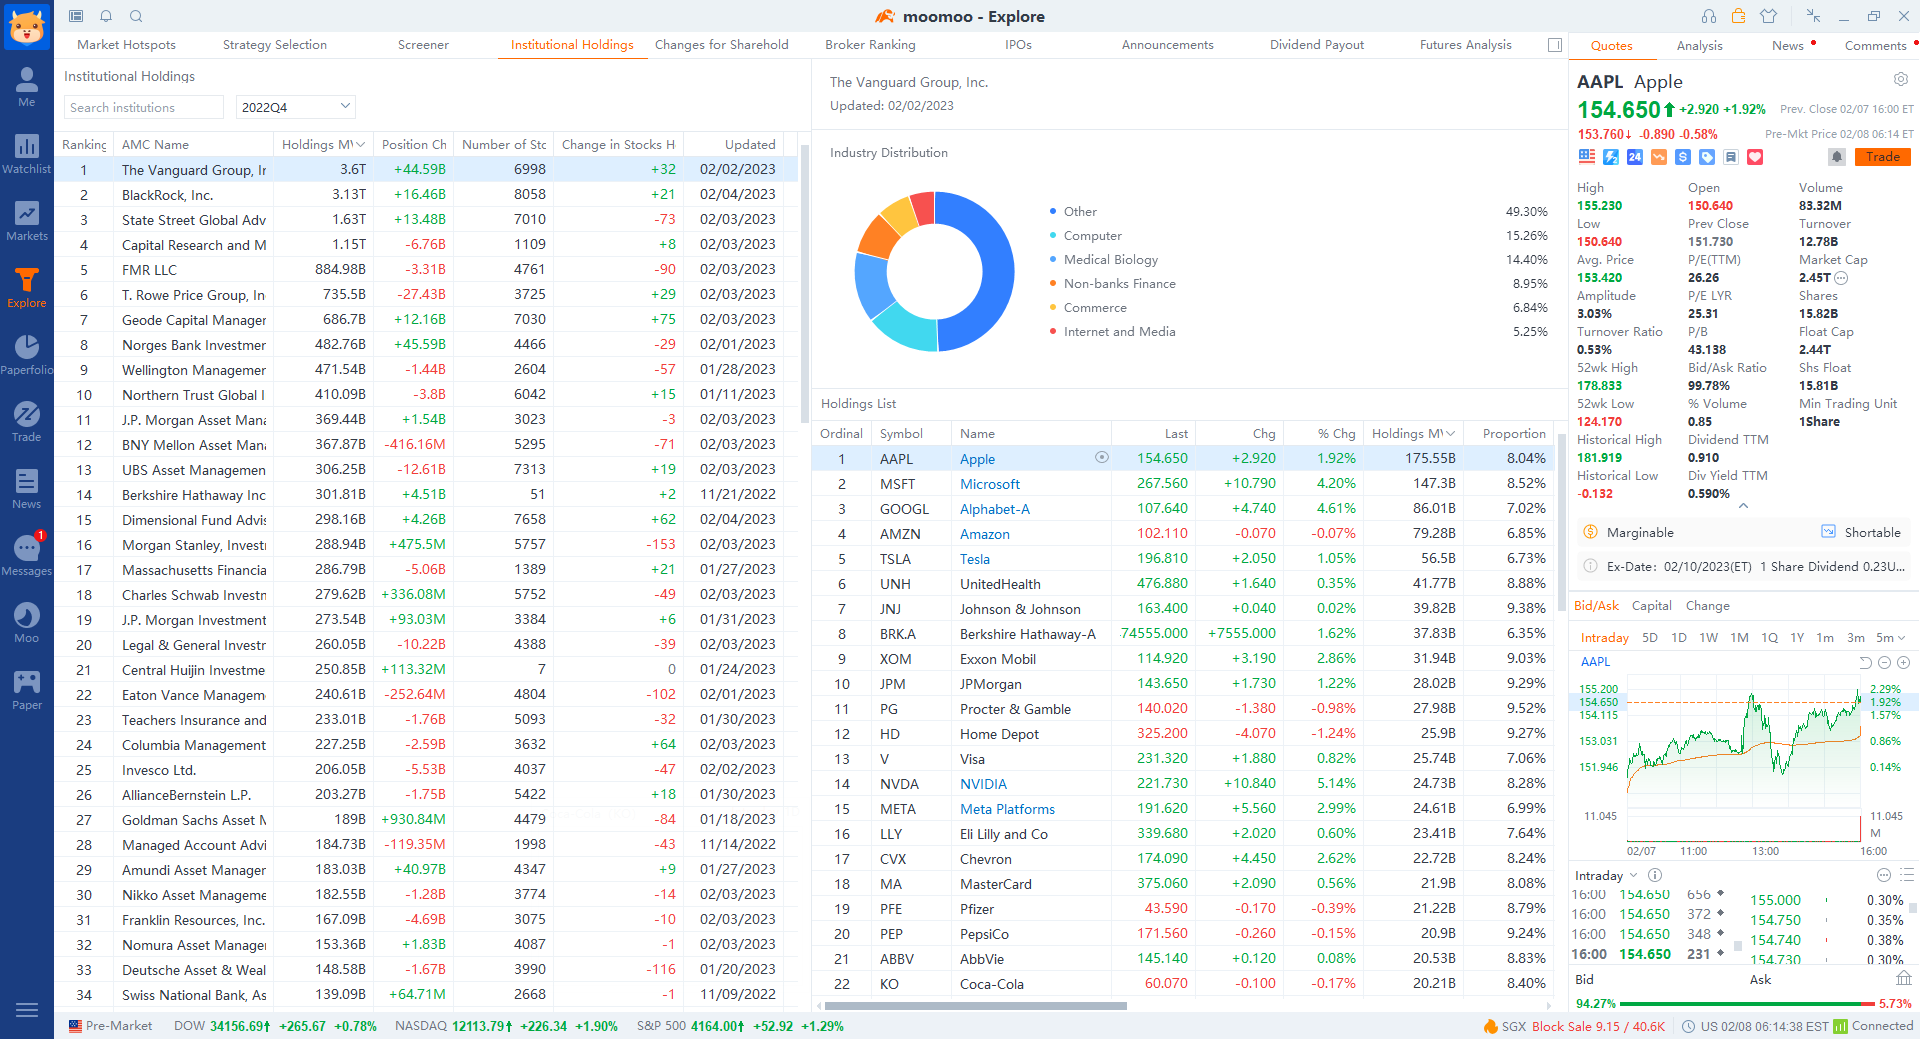
(Please note that the application interface and its content shown above may differ from the actual application interface and content. To avoid any discrepancies, please update the application to the latest version available. The securities mentioned in the screenshot are for illustrative purposes only and should not be construed as investment advice.)
2. Introduction
2.1 Rationale
The US Securities Regulatory Commission (SEC) requires fund managers of institutions with assets under management of more than $100m to provide the SEC with quarterly position reports. By tracking the securities held by these institutions, investors can understand their investing logic and trends, and learn from their investing strategies.
2.2 Home Page
You will see Top Institutions and Trending Stocks on the home page.
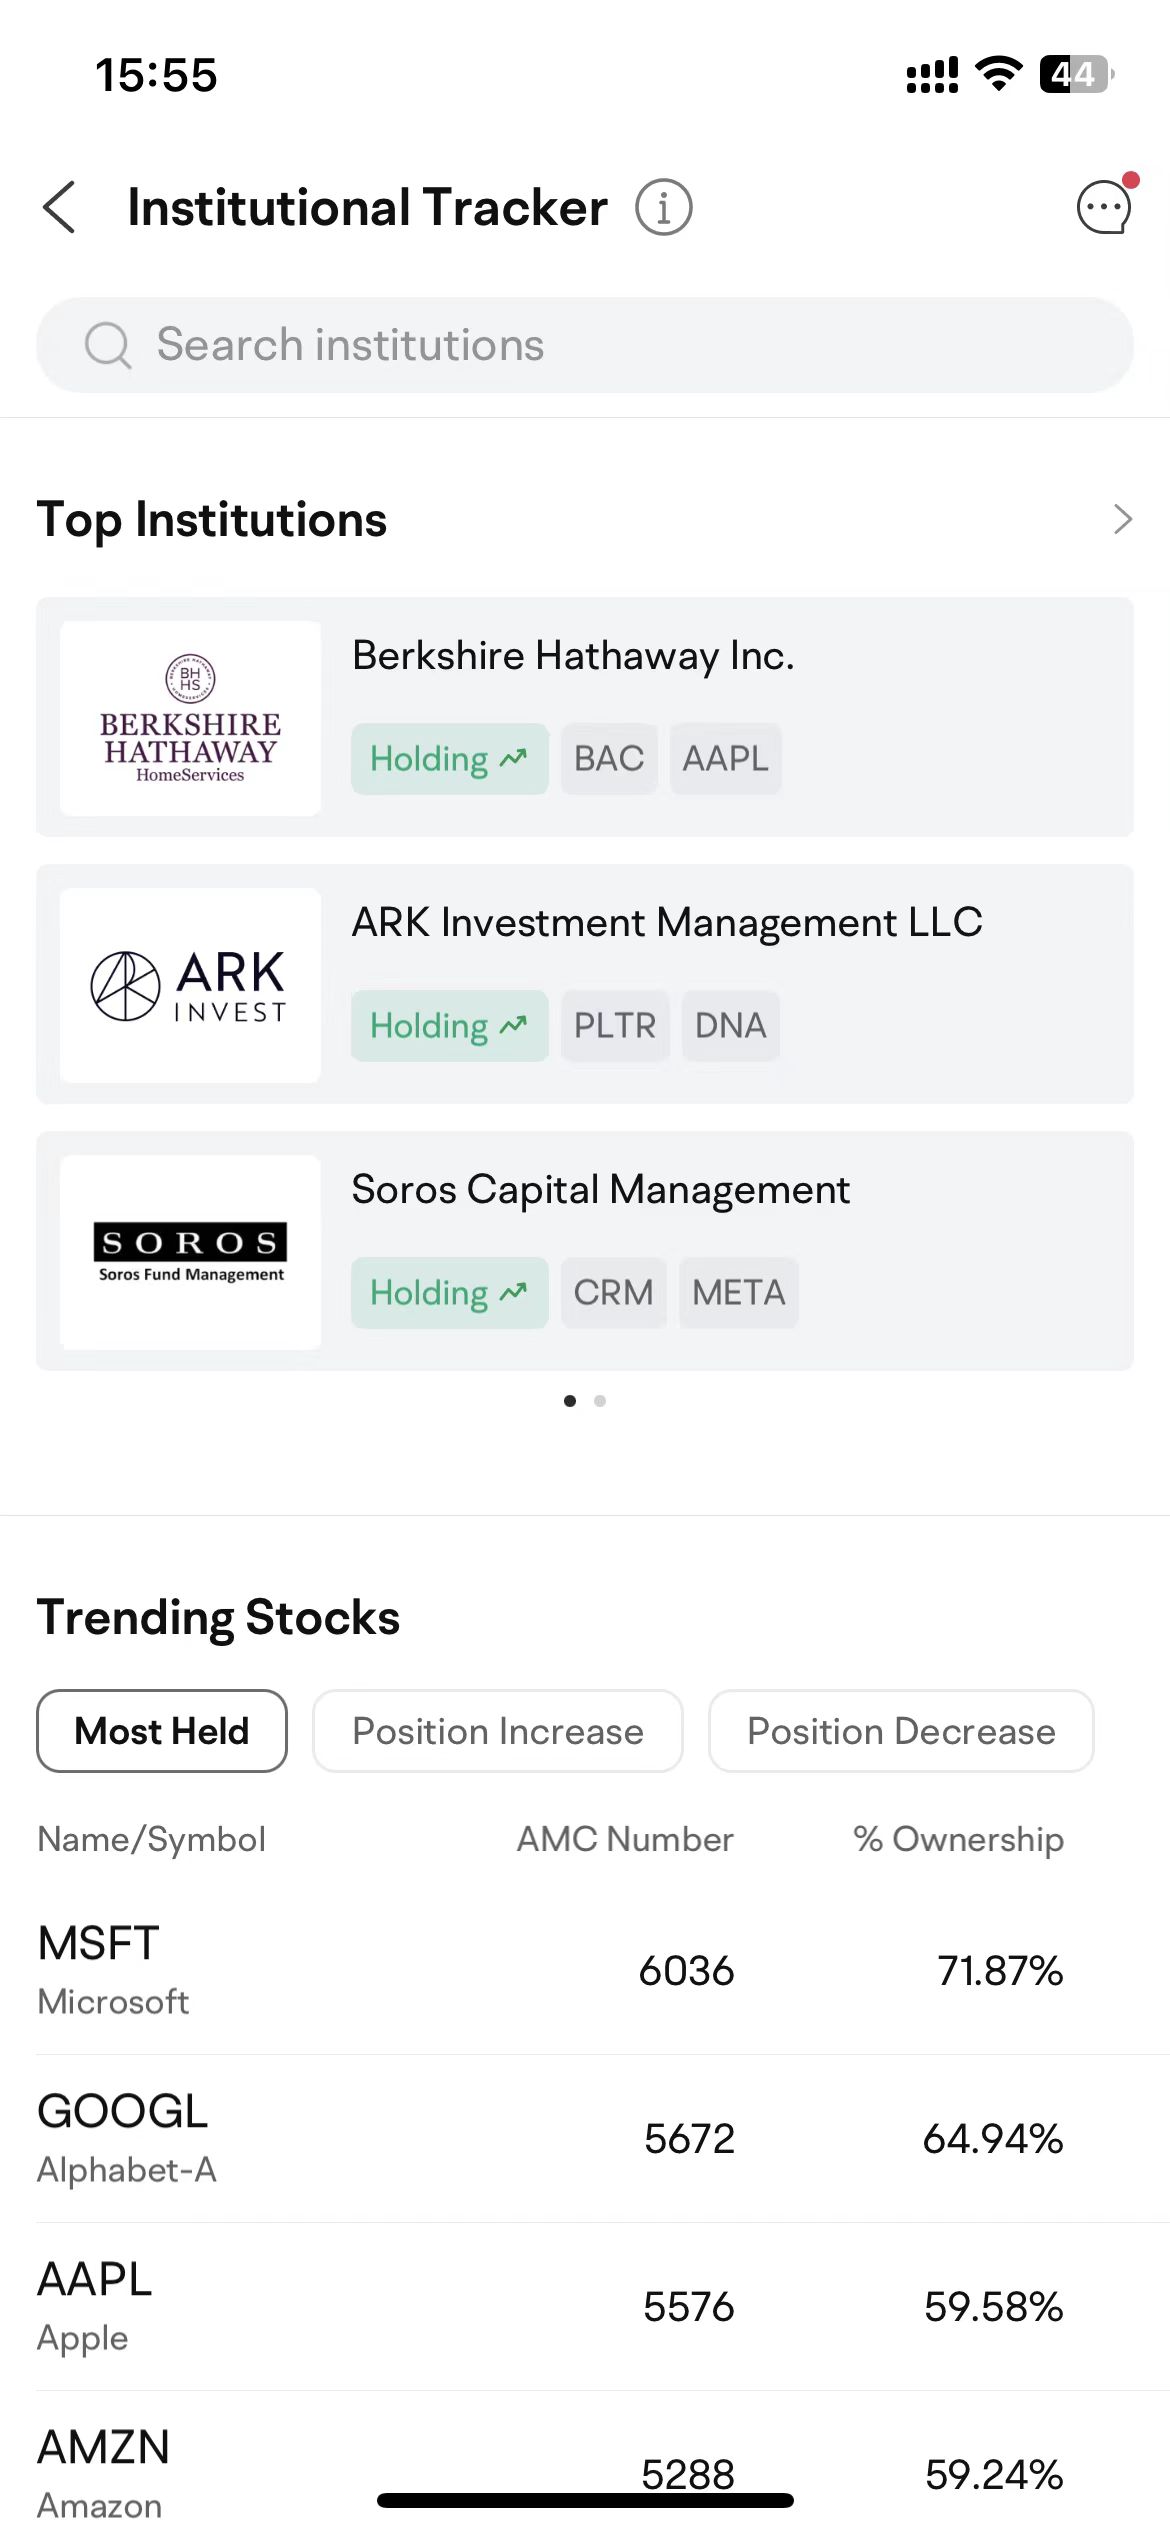
(Please note that the application interface and its content shown above may differ from the actual application interface and content. To avoid any discrepancies, please update the application to the latest version available. The securities mentioned in the screenshot are for illustrative purposes only and should not be construed as investment advice.)
2.3 Top Institutions Page
On the Institutions page, you can find a search box and a top institutions list.
2.3.1 Top Institutions List
This module gives three types of rankings. The first list ranks the institutions by market value of holdings, and the other two, by change in holdings. In the list, you may find the following information, as well as its last updated dates:
• MV: the market value of the stocks held by the institution for the current period
• MV Chg: changes in the market value of the stocks held by the institution for the current period
• Number of Stocks Held: the number of shares held by the institution
• Change in Stocks Held: changes in the number of shares held by the institution as compared to the previous period
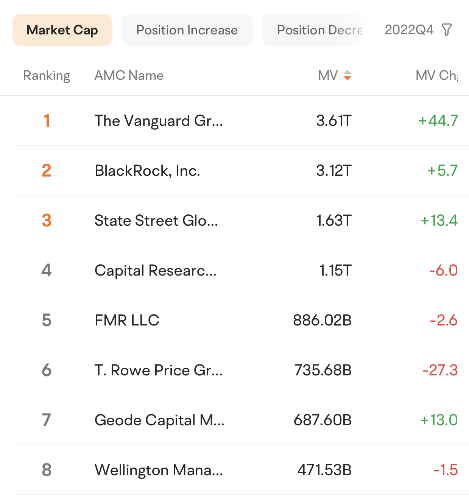
(Please note that the application interface and its content shown above may differ from the actual application interface and content. To avoid any discrepancies, please update the application to the latest version available. The securities mentioned in the screenshot are for illustrative purposes only and should not be construed as investment advice.)
2.4 Detailed Holdings Page
Tapping an institution leads you to its detailed holdings page. You may find three modules on this page, i.e. Overview, Industry Distribution, and Holdings List.
2.4.1 Overview
This module provides the following information:
• Current Holdings MV: the market value of the stocks held by the institution for the current period
• Prior Holdings MV: the market value of the stocks held by the institution for the previous period
• New Holdings: the number of shares of the stocks newly held by the institution
• Increased Holdings: the number of shares, of currently held stocks, newly bought by the institution
• Liquidated Holdings: the number of shares of the stocks sold out by the institution
• Reduced Holdings: the number of shares, of currently held stocks, sold by the institution
• % of Top 10 Holdings: the proportion of the market value of the top 10 holdings to the total market value of all holdings of the institution
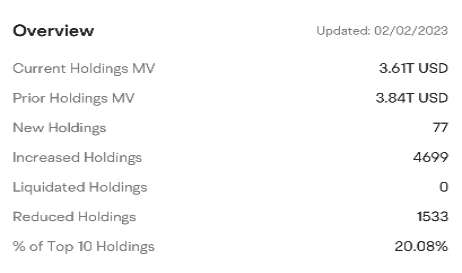
(Please note that the application interface and its content shown above may differ from the actual application interface and content. To avoid any discrepancies, please update the application to the latest version available. The securities mentioned in the screenshot are for illustrative purposes only and should not be construed as investment advice.)
2.4.2 Industry Distribution
The pie chart in this module presents the proportion of the market value of the institution's holdings in each industry to the total market value of all its holdings.
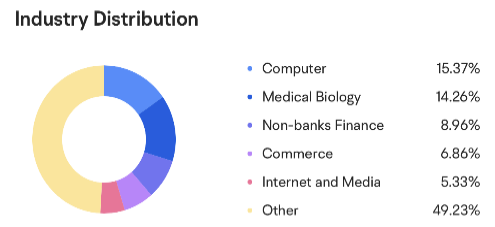
(Please note that the application interface and its content shown above may differ from the actual application interface and content. To avoid any discrepancies, please update the application to the latest version available. The securities mentioned in the screenshot are for illustrative purposes only and should not be construed as investment advice.)
2.4.3 Holdings List
This module shows the institution's holdings in each company by market value, in descending order by default. In addition to stock symbols and industries, you may find the following information in the list:
• Holdings MV: the market value of the stock held by the institution
• % of Float: the proportion of the market value of the stock held by the institution to the total market value of the stock
• Last Value: the proportion of the market value of the stock held by the institution for the previous period to the total market value of the stock
• Holdings Chg: changes in the number of shares of the stock held by the institution
• % of Holdings Chg: the proportion of changes in the number of shares to the total shares outstanding for the previous period
• % of Portfolio: the proportion of the market value of the stock held by the institution to the total market value of all its holdings
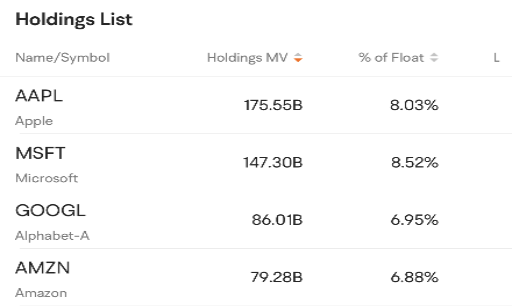
(Please note that the application interface and its content shown above may differ from the actual application interface and content. To avoid any discrepancies, please update the application to the latest version available. The securities mentioned in the screenshot are for illustrative purposes only and should not be construed as investment advice.)
风险及免责提示 This presentation is for informational and educational use only and is not a recommendation or endorsement of any particular investment or investment strategy. Investment information provided in this content is general in nature, strictly for illustrative purposes, and may not be appropriate for all investors. It is provided without respect to individual investors’ financial sophistication, financial situation, investment objectives, investing time horizon, or risk tolerance. You should consider the appropriateness of this information having regard to your relevant personal circumstances before making any investment decisions. Past investment performance does not indicate or guarantee future success. Returns will vary, and all investments carry risks, including loss of principal. Moomoo makes no representation or warranty as to its adequacy, completeness, accuracy or timeliness for any particular purpose of the above content.
Overview
- No more -