BItcoin Charts 4/30/2024
Good morning! I hope everyone is doing well and enjoying their week in the markets.
Today is Tuesday, April 30th. The last day before "sell in may and stay away" until October 31st and the Cryptomarkets are reacting! Hahaha, of course that saying does not hold too much weight over cryptomarkets, but as we continue to correlate crypto with the overall markets such as SPY and with the increasing attention brought to Bitcoin, it might be an indicator of a short term reversal.
Anyways, let me take a look at the charts!
(I will be posting in the way I did last time for simplicity and effeciency)
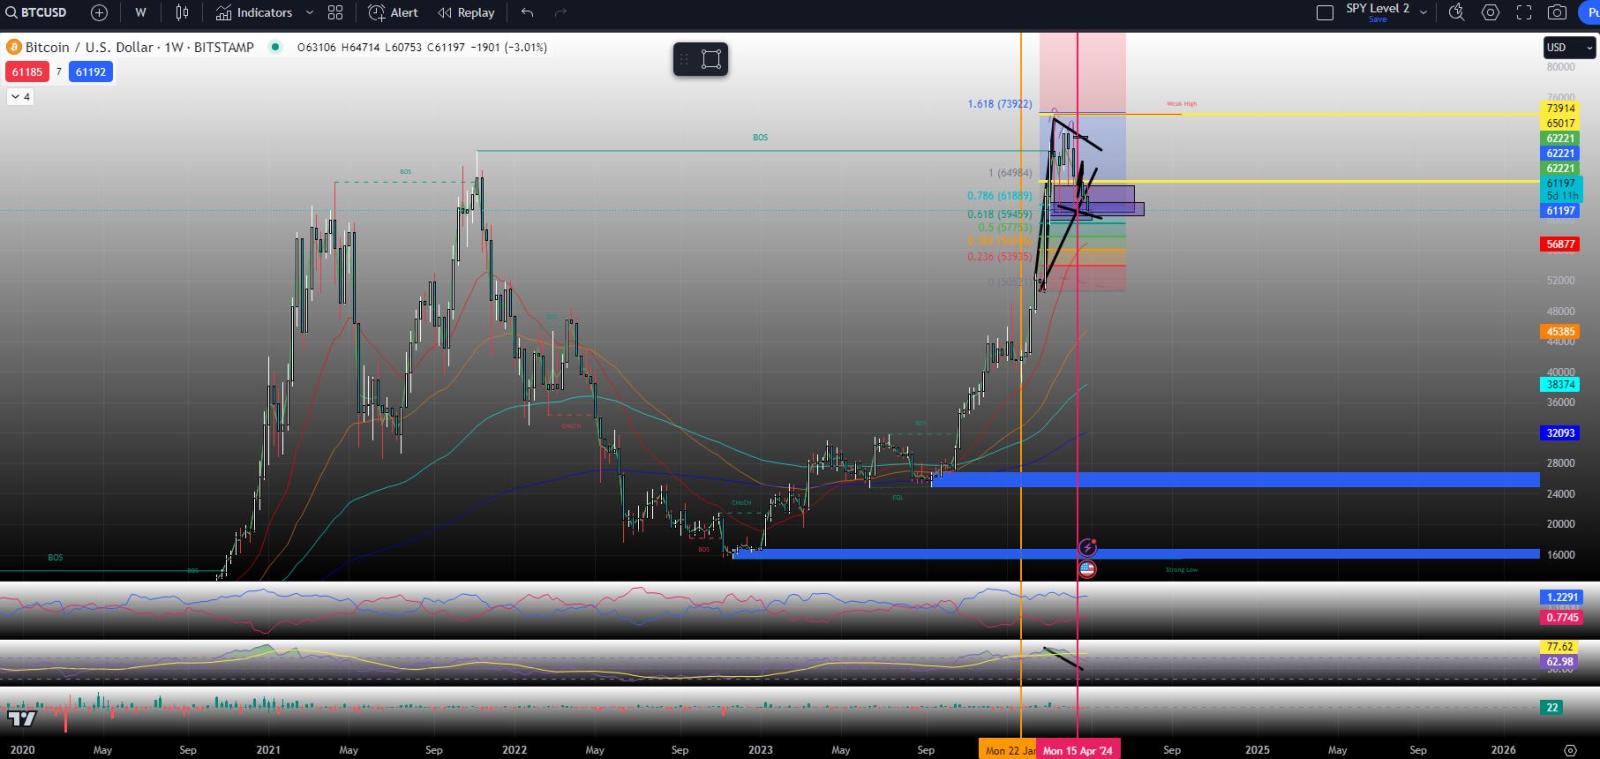
Bitcoin Weekly

There is a few things to mention about this chart.

Bitcoin Daily

This is as big of a buyer / seller battle here as you could ever get. Lots of buying liquidity taken out as the sellers still remain at the highs.

Bitcoin 4 Hour

Liquidity battle occuring right now on the 4 hour chart.
Bitcoin 1 Hour

About the same setup from the 4 Hour is on the 1 Hour
Bitcoin 15 Minute

Buyers look like they have lost the tape here, but are trying to reclaim it.
Bitcoin 5 Minute

Sellers are still keeping Bitcoin pined to the lows.
Bitcoin 1 Minute

As I mentioned, this is a huge buying / selling war going on at the level before the next possible break out to either direction.
Conclusion
In totality, although Bitcoin is moving lower, it is essentially neutral on all time frames and will continue to be neutral unless we break out to either side on the higher time frames. I would hardly call this a large move.


On the daily time frame, this 15% move is actually pretty small for Bitcoin, considering that Bitcoin could make a 22% move to the upside over a fewer amount of bars and days.
From the charts:
So relativly speaking, no move has been made yet. However, we are about to see if the price will move lower with volume if the sellers break below the Weekly bull Flag.
If the Buyers do step up and reject the price this week confirming the 3rd retest and rejection off the lows, then the Weekly Cup and Handle might take shape and we could see a new all time high. However, historically this is unlikely as 100% of larger moves have occured after 100 days.
Bitcoin's situation may be different due to its now much larger audiance and insitutional traders, but for that reason you have to remember its not just you and I playing the Cryptomarkets. Smart Money has entered the lobby and are here to stay and they do not like losses and will do what they have to in the long term to make up any losses experienced on larger moves to the downside.
Thank you for reading and all of the support! I hope you all have a great week in the markeks. I am still working on new Polgon Charts, but it is a bit more difficult to get right as it is not a stable coin. However, I will do what I can to provide a quality article and keep my information clear and effecient.
At the time of writing, bitoin is at $60,861
Disclaimer: Community is offered by Moomoo Technologies Inc. and is for educational purposes only.
Read more
Comment
Sign in to post a comment

102886247 : here is a tip. do spell check before posting.. we are not sure if your post is reliable