GameStop (GME)

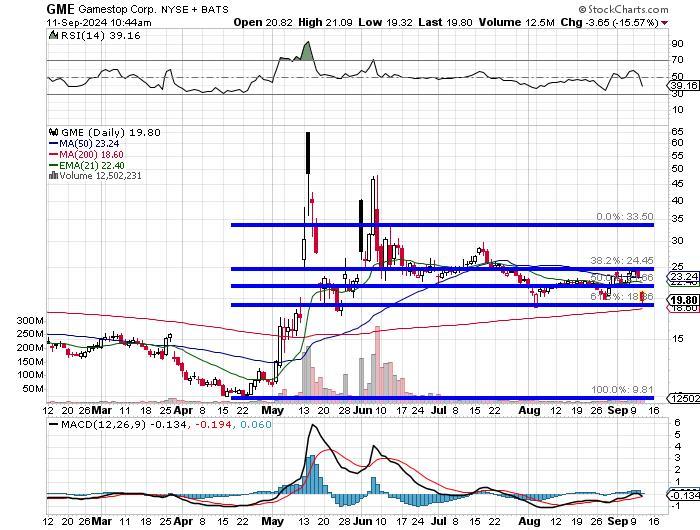
If investors can omit the "Roaring Kitty" nonsense and just not see the spikes of this past May and June, they will then see that a high that may not have been skewed by the Kitty occurred on June 12th. A Fibonacci model laid over the actions of this stock recognizing that high as "the high" of the cycle, shows that support has been found upon multiple occasions at a 61.8% retracement of that move. Let's look at this another way...

Readers will see that what has developed, is a descending triangle, which is considered to be a bearish pattern. The gap lower open this morning has placed the last sale below both the 50-day SMA and 21-day EMA. The shares seem likely to retest the above-mentioned Fibonacci level which is the support line for the triangle.
Both the reading for RSI and the daily MACD are weakening. What matters now is what happens at that support line, as it is running concurrently with the stock's 200-day SMA. A break of that line could very well lead to sub $15 levels. At some point, a downsized business with a strong balance sheet like GME has and some level of positive cash flow (as GME has) will eventually be investible.
Disclaimer: Community is offered by Moomoo Technologies Inc. and is for educational purposes only.
Read more
Comment
Sign in to post a comment

Chronic Line Stepper : The cat didn't make it happen.He took advantage of it. And it's going to happen again, are you ready is the question