Tesla Q2 delivery beats boost stock price, aiming for 2024 record high?
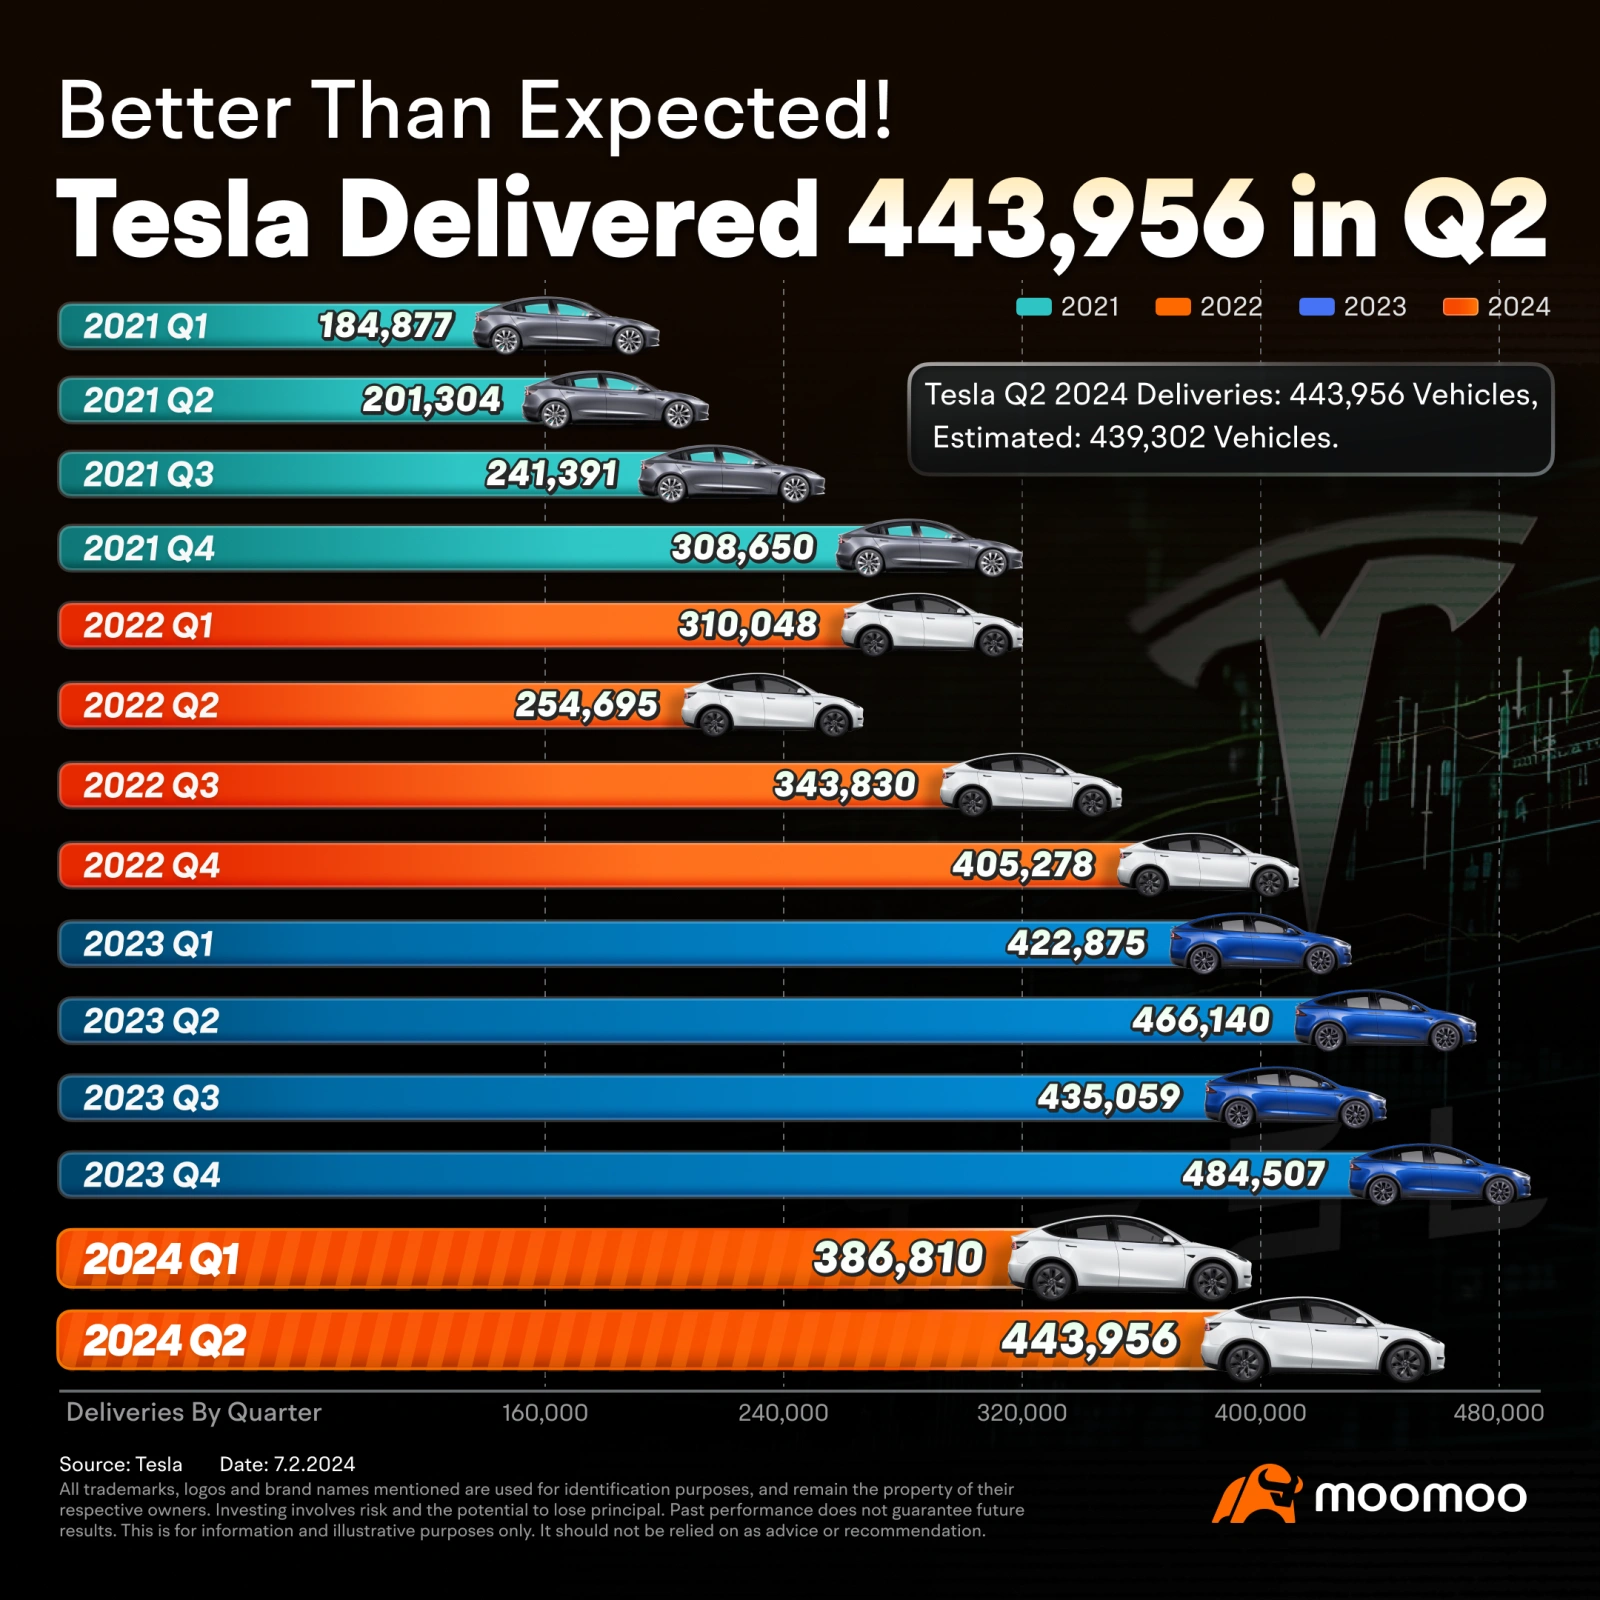
On July 2nd, $Tesla(TSLA.US$ announced its Q2 delivery volume of 443,956 vehicles, outstripping the market consensus of 439,000. Following the release of this robust delivery performance, Tesla's stock price has been climbing steadily.

Will Tesla set a new stock price record for 2024?
From a technical analysis perspective, after a period of decline at the start of the year, Tesla's stock has made a robust comeback, soaring over 40% since the Q1 earnings report on April 24th, with the price briefly near the $200 mark.
As of July 4th, Tesla stock's trend has formed a 'Head and Shoulders Bottom' pattern, which is a classic bullish reversal pattern that suggests the price may have found its bottom and could be poised for an upward reversal.

Images provided are not current and any securities are shown for illustrative purposes only and is not a recommendation.
What is a 'Head and Shoulders Bottom' pattern?
The 'Head and Shoulders Bottom' pattern is a typical bullish reversal pattern in the stock market that typically appears at the end of a downtrend. It indicates that the stock may have the ability to move upward against the trend.
The pattern contains three successive troughs. The middle trough (head) is the deepest and the two on the side (shoulders) are shallower.
The pattern usually appears when a security's price action shows the following characteristics:
1. This pattern emerges during a noticeable downward trend.
2. The left shoulder exhibits a bounce-back while the price is decreasing.
3. Following another decrease in price, a head signal arises, succeeded by a second bounce-back.
4. After the second rise, the price drops again to form the right shoulder.
5. Simultaneously, a neckline appears between the highest points 1 and 2.

Actually, the Head and Shoulders Bottom is just one of many bullish chart patterns, and the image below summarizes other classic bullish and bearish chart patterns.

However, paying attention to the chart pattern of a signal to determine the subsequent trend of the stock price is not enough, we need to combine it with other technical indicators to make more informed decisions.
If you want to learn more about trading tutorials, click to join moomoo learn Premium.

Behind this rise in Tesla's stock may also involve investor expectations for other aspects of its future growth, like Robotaxi, energy business, and AI robotics.
What do you think of Tesla's stock price next? Feel free to leave your comments~
Disclaimer: Moomoo Technologies Inc. is providing this content for information and educational use only.
Read more
Comment
Sign in to post a comment

mr_cashcow :
steady Pom pipi :
ZnWC :
ZnWC :
riccywiild mr_cashcow : $E-micro Gold Futures(AUG4) (MGCmain.US)$
Kenneth Edwards : TSLA has been “head and shoulders” above its competition since 2008.
Minime88 :![undefined [undefined]](https://static.moomoo.com/nnq/emoji/static/image/default/default-black.png?imageMogr2/thumbnail/36x36)
102801890 : all the way up!
Jason Johnson539 : I knew it was possible
Liem Nguyen : Nice
View more comments...