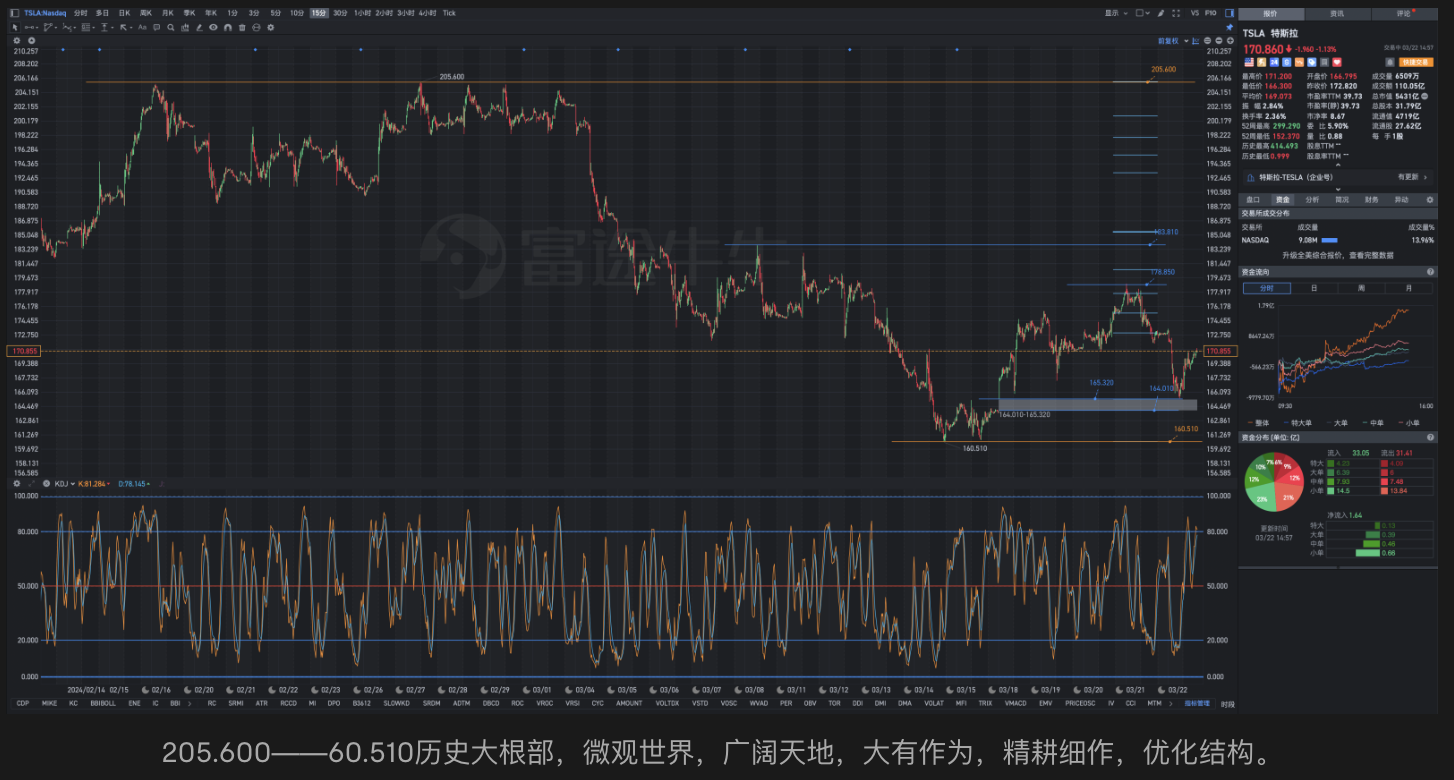
Having a technical chart framework in mind, and having the financial firepower in hand.
Hint: Paganini, afraid of anything. Confronting the enemy when they come, and taking cover when they come. Today, despite the market decline, the overall performance of the bull is commendable.
Tesla stock price historical major bottom area: 205.600-160.510;
Tesla stock price historical bottom discharge area: 160.510-152.370-146.410;
Tesla stock price super extreme area: 101.810-36.600-23.370
Tesla stock price historical bottom discharge area: 160.510-152.370-146.410;
Tesla stock price super extreme area: 101.810-36.600-23.370
Possible: Is the not-so-ideal performance of Q1 currently being digested? If so, continuous decline is not necessarily scary, and may not be a bad thing. The decline is the process of risk release.
What is meant by stabilizing? What does it mean to wait for stability before buying? That is the static ideal state imagined by opportunistic speculators, which simply does not exist in the actual financial game. Stock prices themselves are constantly fluctuating, with significant fluctuations.
Investment guru Peter Lynch said, "In the past 70 years of history, there have been 40 stock market crashes. Even though I predicted 39 of them in advance and sold all my stocks before the crash, I still regret it deeply. Because even in the biggest stock market crash, the stock prices eventually rebound and rise even higher than before."
Excellent companies will continue to set new historical highs and can withstand both bull and bear markets. For excellent companies, bear markets are only temporary, while bull markets are eternal.
Core technology: Overcoming human weaknesses is difficult and the majority of people cannot achieve it or can only achieve it to a limited extent.
Following the overall trend - For Tesla, once it is identified as the target of investment trading, its main trend will always be upward. Currently, the secondary trend is downward and in serious opposition to the main trend.
Against the technology - Extend downwards from below the traditional technical stop loss level by 3-5% to start batch gradient division (the interval between gradients depends on one's own capital, risk resistance, and the achieved decline). Discrete random variable (absolutely cannot take continuous revenge bottom fishing and building positions just because of eager to recover losses, which is extremely unwise and even foolish. It is very likely to lose valuable reinforcement funds in vain, leaving old grievances unsettled and acquiring new hatred.)
Against human nature - When there is no sign of recovery, various media outlets will exaggerate and sensationalize. The herd will put put options and short sell at extremely alarming levels, trying to make big and quick money. This bottom is a dynamic and glorious bottom for the herd.


Disclaimer: Community is offered by Moomoo Technologies Inc. and is for educational purposes only.
Read more
Comment
Sign in to post a comment

71601323 : I can't understand
Elias Chen OP 71601323 : The root area of Tesla's stock price history: 260.600-160.510;
The flood zone at the root of Tesla's stock price history: 160.510-152.370-146.410;
Tesla stock price super extreme area: 101.810—36.600—23.370