Analysis of the Tesla pre-market review chart for Friday, August 16
There are only two types of people who can be the final big winners in the financial market. They are either smart or scum. They have one characteristic in common, which is that they are unwilling to follow the crowd and are different in terms of thinking and operation.
It is human nature to be happy and tired of falling. Human instinct: to see the downturn like a flood or a fierce beast. People would rather open positions when they are rising, rather than open positions in the midst of a falling trend; they are even less willing to use planned, step-by-step, graded batches, and discrete random variables (like one-step placement, continuous function, full attack, V-shaped pull-up, exhilarating, and quick in place) to build long positions. They pursue the so-called layout of opening positions only after the stock price stabilizes. They live in short-term trends and short-term trends; they have no main trends or long-term trends; they only have a microscope in their hands🔬, no telescope🔭; Only a wide-angle lens, no telephoto lens. It is impossible to break through the limits of wealth: live in the present, be drunk today, sad tomorrow
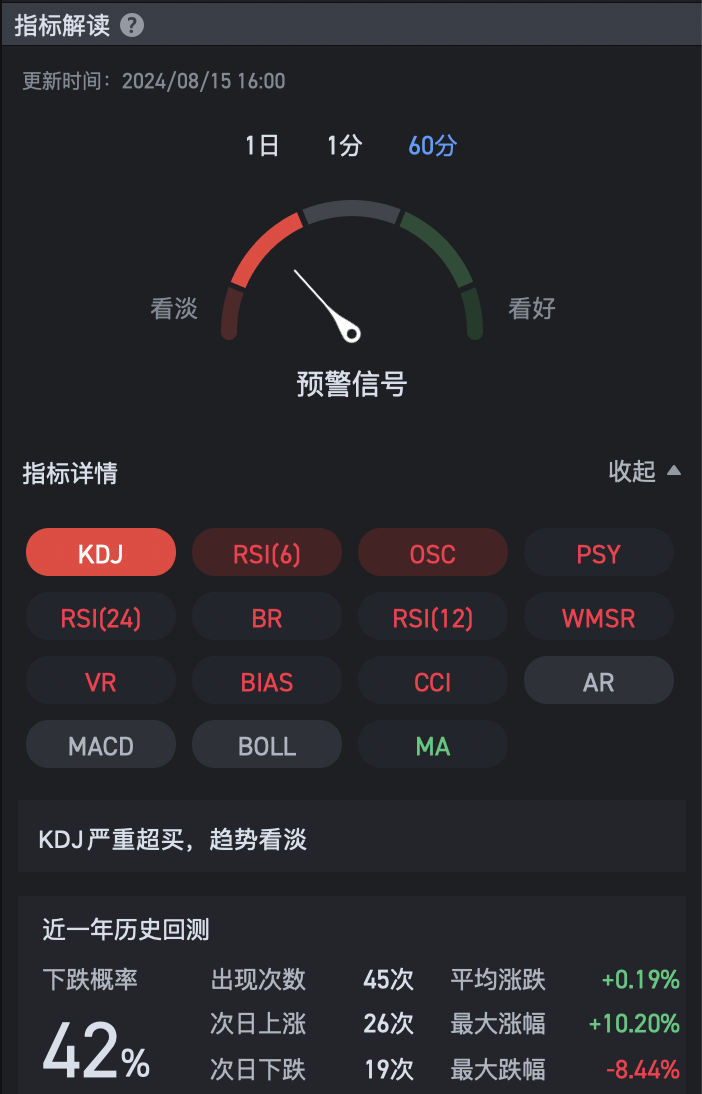
There are pullback requirements for short periods at the hourly level:

The daily level is bullish. The MACD's fast and slow line is yet to be a gold fork, sending a bullish buying signal, and opening positions every time it falls.

Information: What happened when Japanese stocks soared 1,000 points, and global funds took advantage of the low price to “sweep the goods”? On Friday (16th) EST, Japanese stocks rose for a week. As of press release, the Nikkei 225 index rose 3.23% to 37912.09 points, surging 1177.96 points. The rise in Japanese stocks over the past few days has benefited from the receding risks at home and abroad, the domestic economy is basically improving, and stock market liquidity has rebounded.
The moving average is blooming
The blooming of moving averages is the most important part of technical analysis.
The relationship between moving average and price is like the relationship between a person and a pet dog. The price is sometimes above the moving average, sometimes below the moving average, but it always runs around the moving average.
When the stock price hits the moving average, it bounces upward when it is strong, and it bounces downward when it is weak.
The longer the period, the more reliable the moving average. The reliability of the 60-day EMA is stronger than the 30-day EMA, the reliability of the 30-day EMA is stronger than the 20-day EMA, the reliability of the 20-day EMA is strong and the 10-day EMA...
In a strong market, the stock price is entangled with multiple upward moving averages, which is a very good starting point for stock prices. The more tangled moving averages, the greater the certainty of the explosion, and the more impressive the energy of the explosion.
In a weak market, when the stock price rebounds to the moving average, the EMA suppresses the stock price. The long-term EMA suppresses the stock price more accurately than the short-term EMA
In a strong market, try to select stocks whose stock prices run at multiple moving average points. This can not only improve the certainty of growth, but also achieve a rise in stock prices within a short period of time and improve time efficiency. At the same time, sell in due course after the stock price is far from the moving average.
There is nothing wrong with a weak market. If there is a weak rebound, try to choose stocks whose stock prices are below the moving average and are far from the moving average, and throw them out when the momentum of the stock price rebound weakens.


Disclaimer: Community is offered by Moomoo Technologies Inc. and is for educational purposes only.
Read more
Comment
Sign in to post a comment
