Account Info
Log Out
English
Back
Log in to access Online Inquiry
Back to the Top
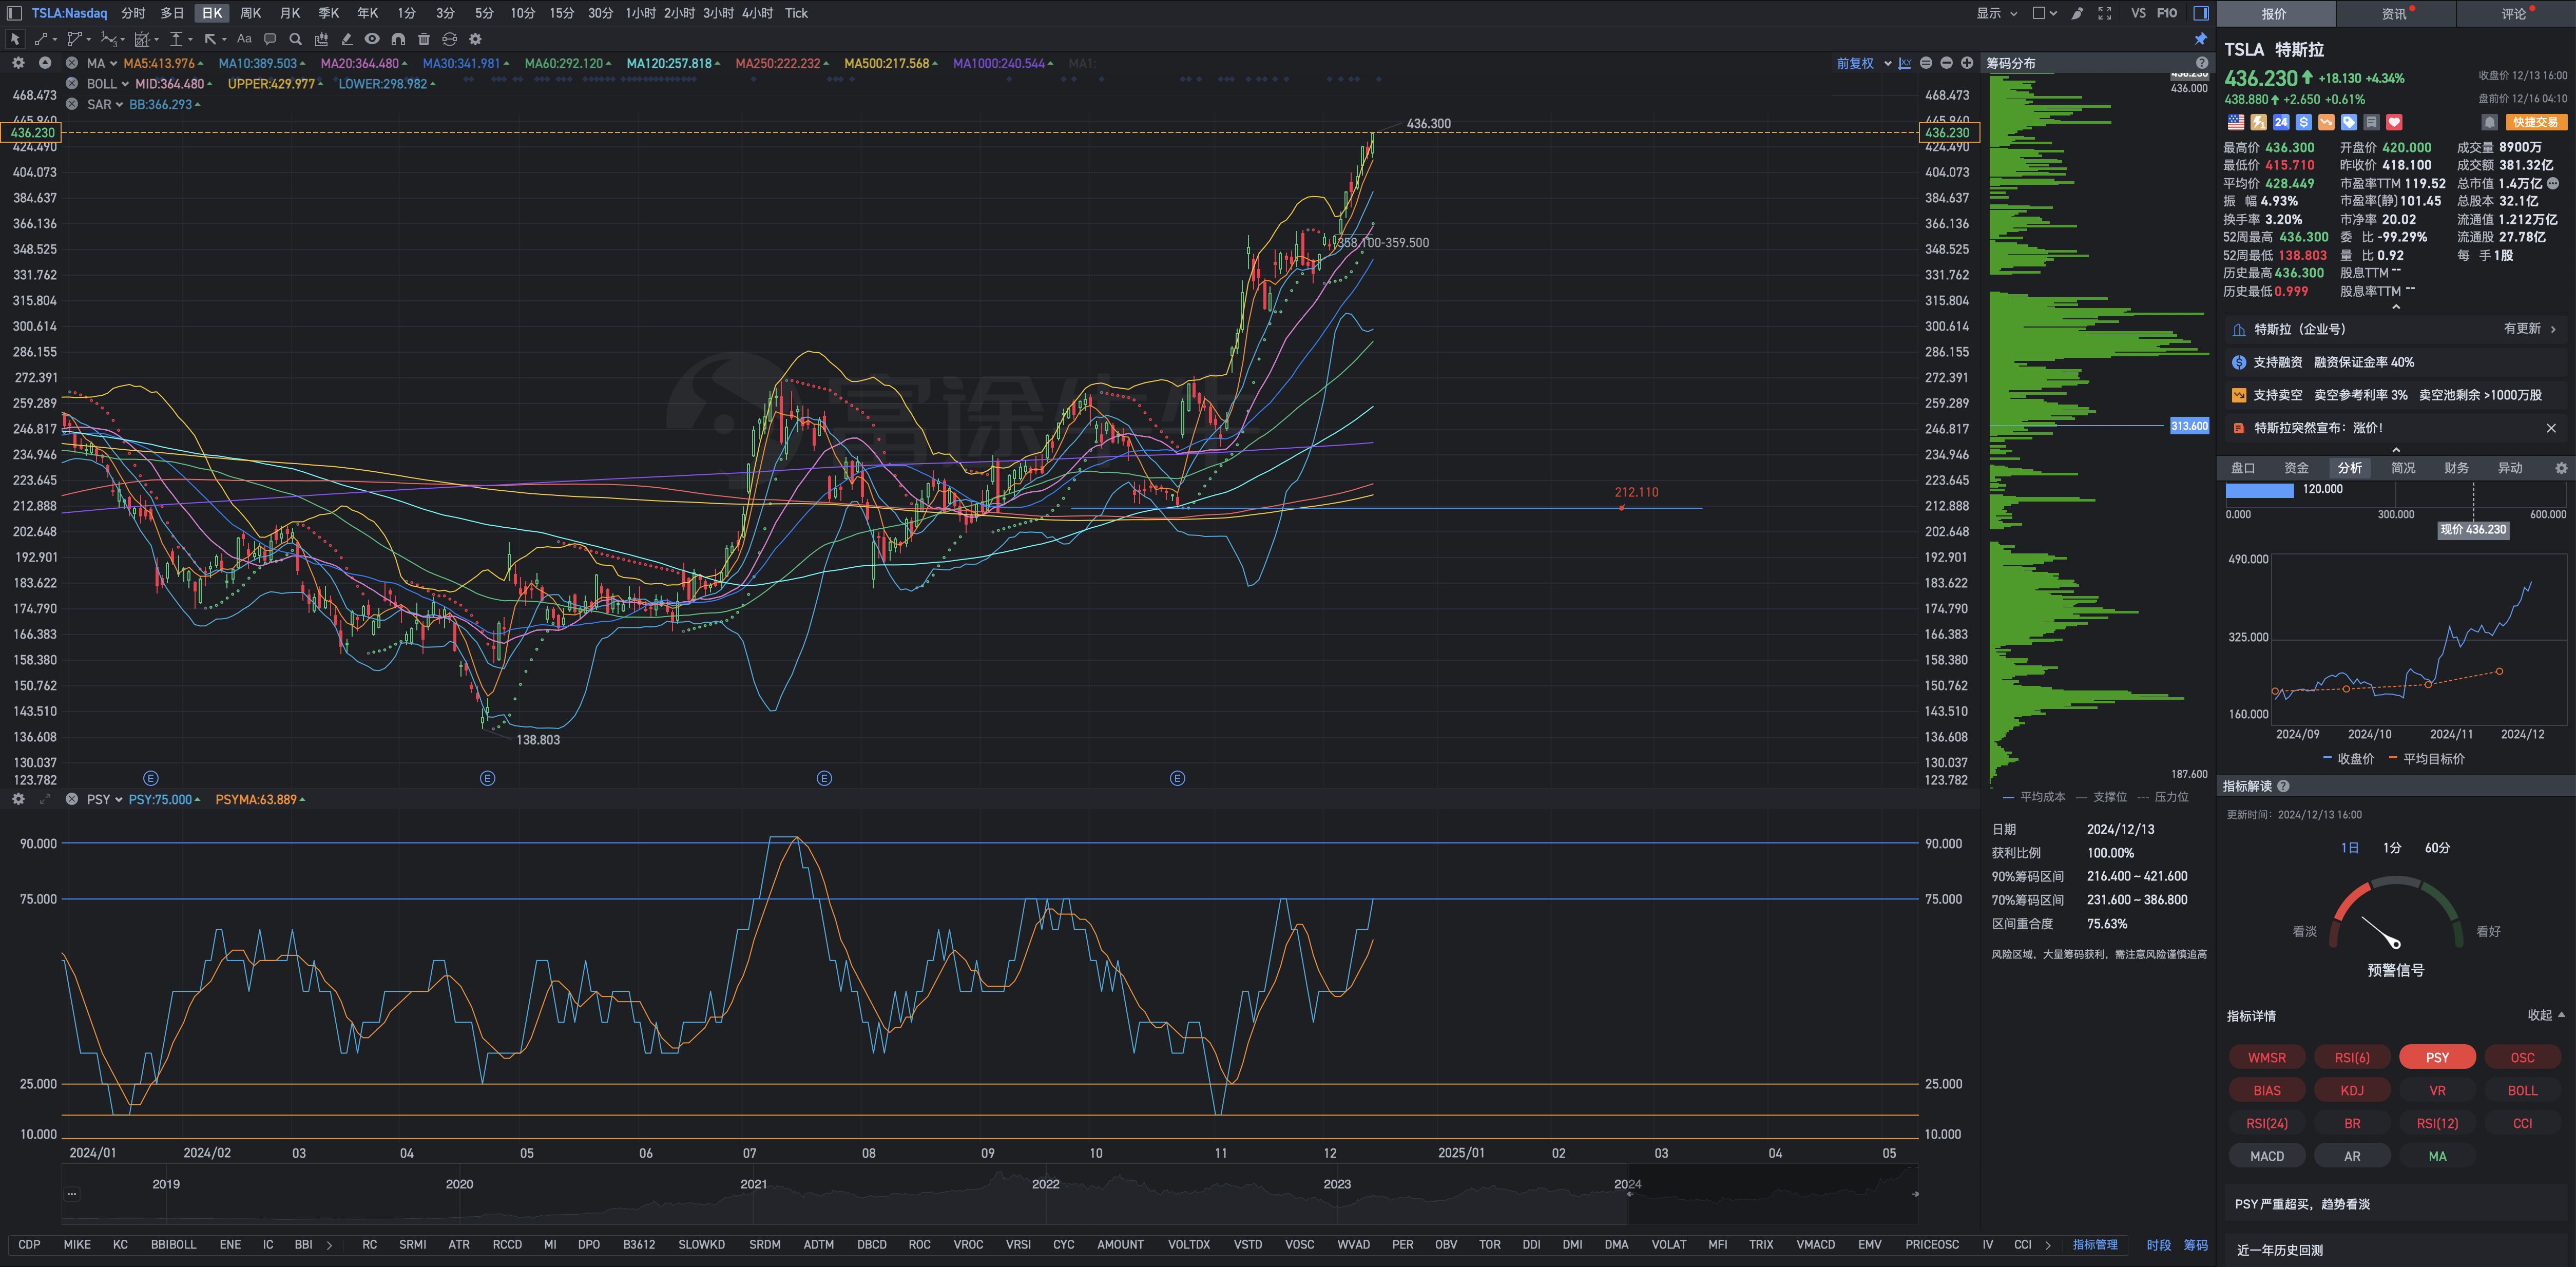
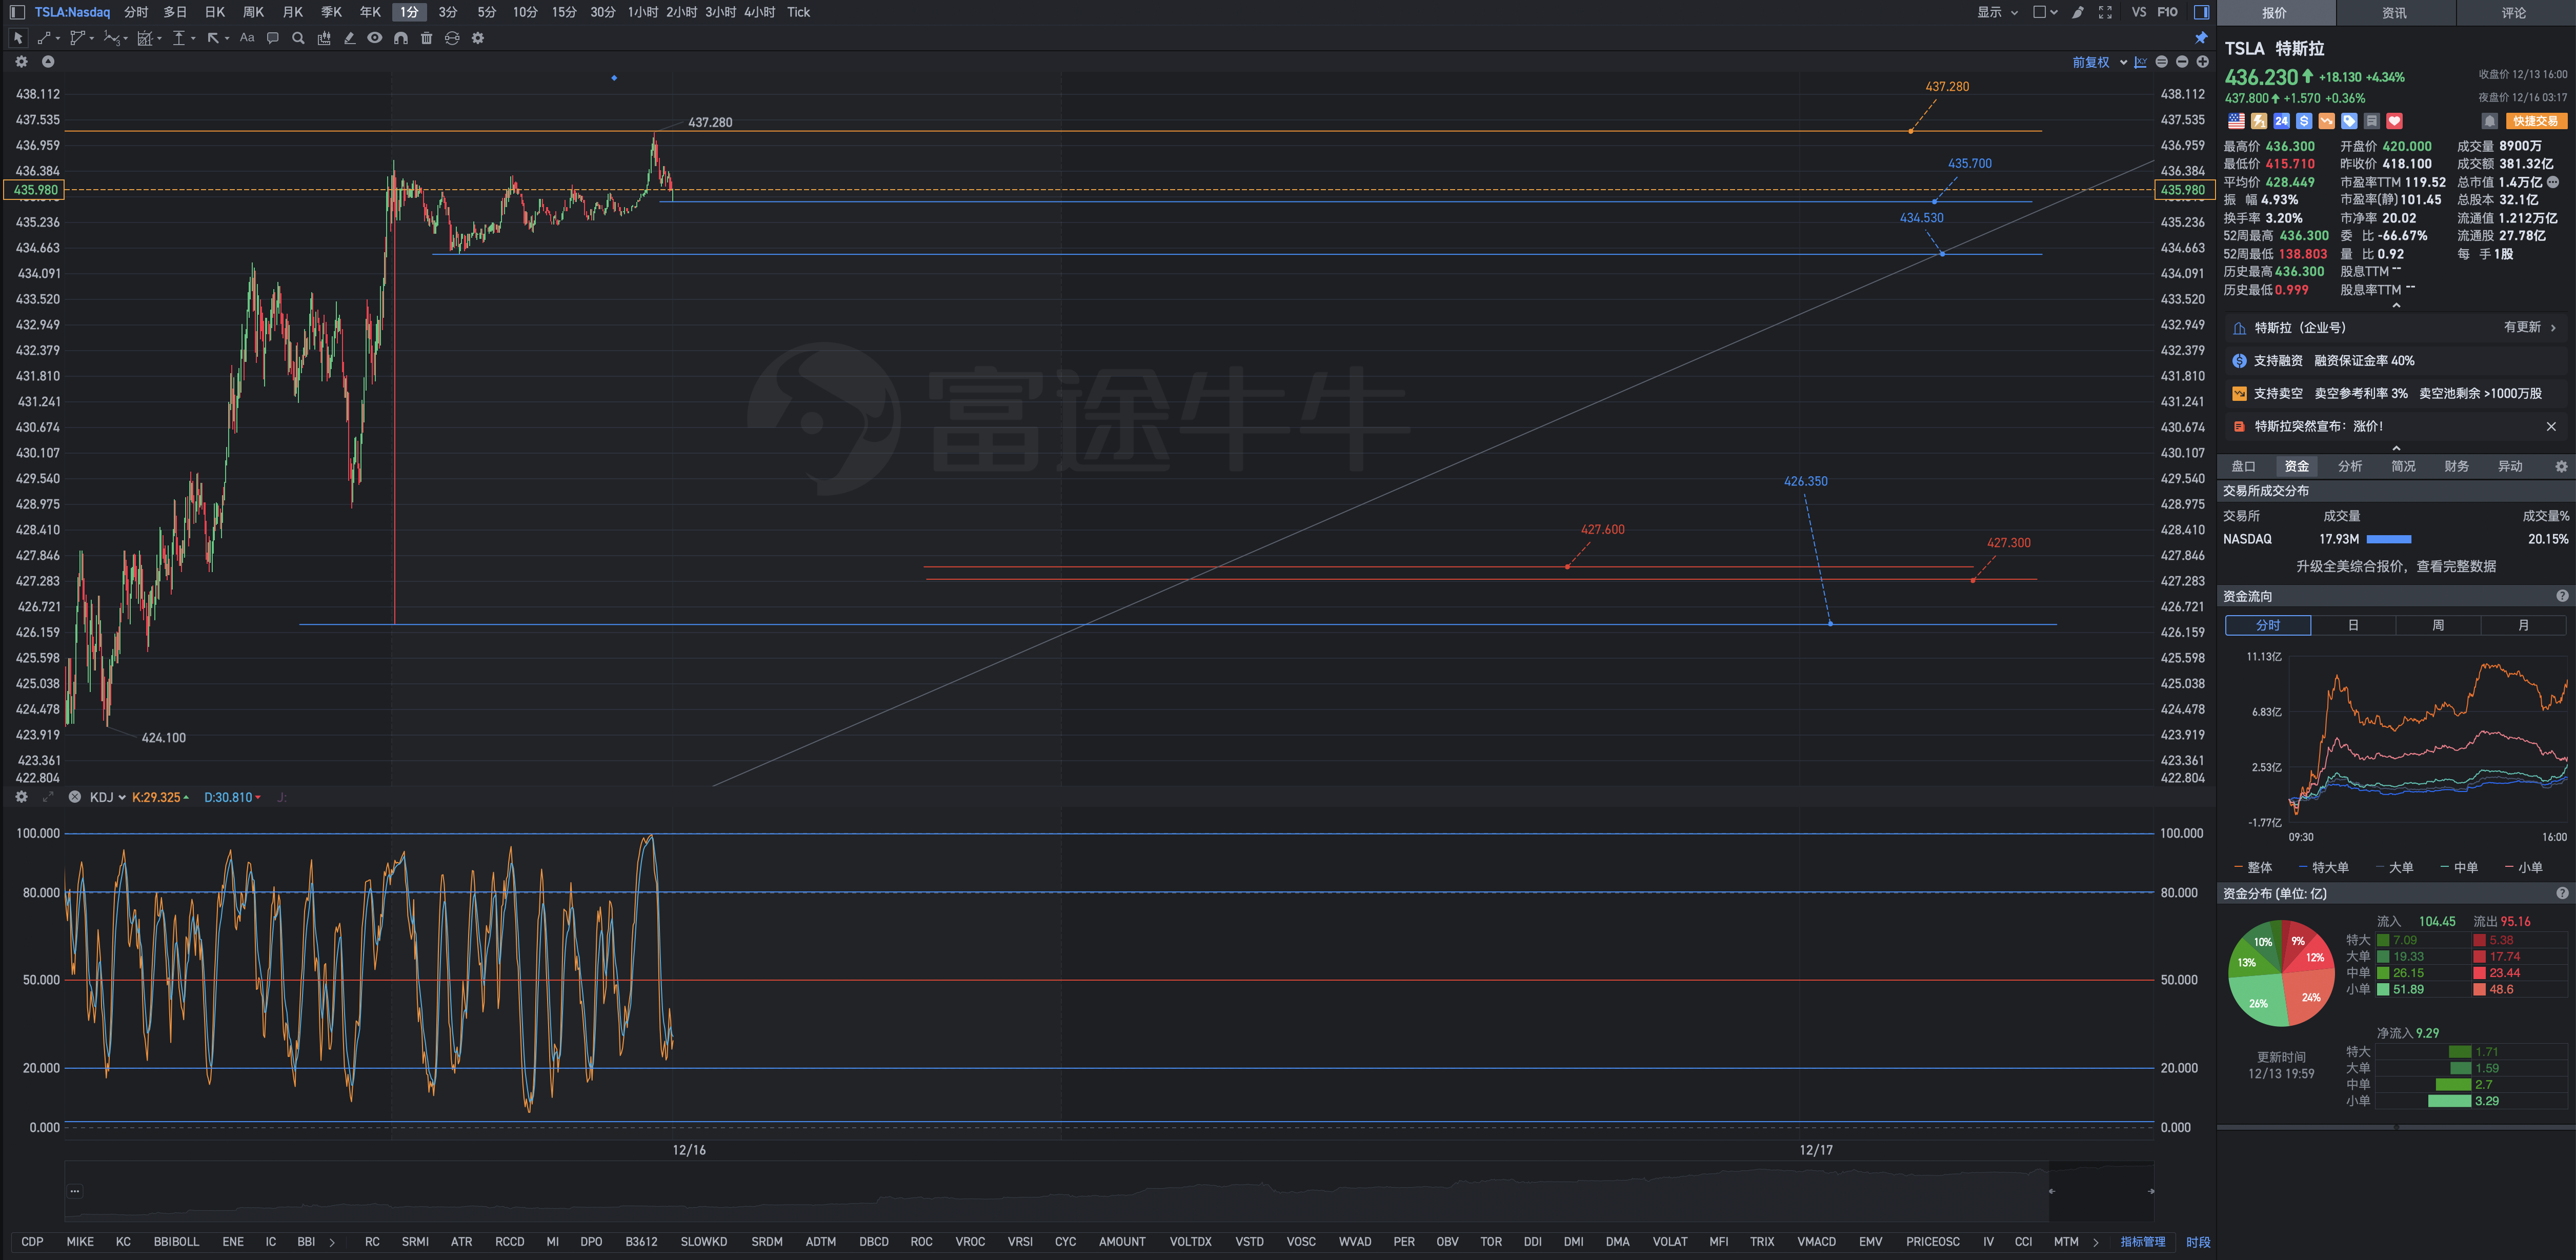
Tesla retraces: Profit-taking or opportunity to buy more?
Views 8M Contents 590

The sharp tool for determining extreme situations: Technical Indicator PSY (Psychological Line Indicator).

Eastern and Western wisdom; qualitative analysis; quantitative analysis; empirical intuition; guided by the Holy Spirit, integrating various approaches.
Eastern wisdom: according to the "Kagi Analysis" -- new value exceeds eight but not ten. Full offense brings loss, humble acceptance brings benefit.
The Bible, Old Testament, Ecclesiastes:
1:2 The Preacher says: Vanity of vanities, all is vanity.
The sharp tool for determining extreme situations: Technical Indicator PSY (Psychological Line Indicator).
1:2 Vanity of vanities, saith the Preacher, vanity of vanities; all is vanity.
1:3 What profit hath a man of all his labour which he taketh under the sun?
1:3 人一切的勞碌,就是他在日光之下的勞碌,有甚麼益處呢?
1:4 一代過去,一代又來,地卻永遠長存。
One generation passes away, and another generation comes: but the earth remains forever.
The sun rises, and the sun sets, hastening back to where it rose.
1:5 The sun also ariseth, and the sun goeth down, and hasteth to his place where he arose.
1:6 風往南颳,又向北轉,不住的旋轉,而且返回轉行原道。
1:6 The wind goeth toward the south, and turneth about unto the north; it whirleth about continually, and the wind returneth again according to his circuits.
1:7 江河都往海裡流,海卻不滿,江河從何處流,仍歸還何處。
1:7 All the rivers run into the sea; yet the sea is not full; unto the place from whence the rivers come, thither they return again.
1:8 萬事令人厭煩〔或作萬物滿有困乏〕人不能說盡,眼看,看不飽,耳聽,聽不足。
1:8 All things are full of labour; man cannot utter it: the eye is not satisfied with seeing, nor the ear filled with hearing.
1:9 已有的事,後必再有,已行的事,後必再行,日光之下並無新事。
1:9 The thing that hath been, it is that which shall be; and that which is done is that which shall be done: and there is no new thing under the sun.
1:10 Is there any thing whereof it may be said, See, this is new? it hath been already of old time, which was before us.
1:11 There is no remembrance of former things; neither shall there be any remembrance of things that are to come with those that shall come after.
1:11 The past generations are not remembered, and the people to come will not be remembered by those who come after them.
1:11 There is no recollection of the events of the past, and even the events of the future will not be remembered by those who follow.
PSY (Psychological Line) indicator: An emotional indicator of investors' psychological fluctuations in response to the rise and fall of the stock market.
The Psychological Line (PSY) Indicator is a psychological indicator that studies investors' emotional fluctuations in the stock market. It has certain reference significance for judging the short-term trends of the stock market.
The Psychological Line (PSY) Indicator converts investors' psychological inclination towards buying or selling during a certain period into numerical values, thereby determining the future trend of stock prices.
On one hand, people's psychological expectations are directly proportional to the market trend; if the market is rising, expectations rise, if the market is falling, expectations fall. On the other hand, when people's psychological expectations are close to or reach an extreme, contrary psychology begins to take effect, and may ultimately lead to a reversal of the direction of psychological expectations.
Calculation formula
1. PSY = (Number of rising days in N days / N) * 100
2. PSYMA = M-day simple moving average of PSY
Application rules
1. Before a downward (upward) trend unfolds, the highest (lowest) point of overbought (oversold) conditions typically appears twice. When the second overbought (oversold) high (low) point occurs, it is generally a time to sell (buy). Due to the characteristic of PSY indicator having these densely spaced high points, it gives investors ample time for analysis and intervention.
2. The PSY indicator is normally distributed between 25 and 75. The PSY indicator mainly reflects the market's overbought and oversold sentiment. Therefore, when the psychological line indicator moves up and down within the normal range, investors should generally take a wait-and-see attitude.
3. When the PSY indicator exceeds 75 or falls below 25, it indicates that the stock price is starting to enter an overbought or oversold area, at this time, one needs to pay attention to its movement. When the percentage value of the PSY indicator exceeds 83 or falls below 17, it indicates that the market is in an overbought or oversold area, the chances of price retracement or rebound increase, investors should prepare to sell or buy, regardless of whether the second signal appears. This situation is more common in individual stocks.
4. When the PSY indicator percentage value is less than 10, it is extremely oversold. The opportunity to grab a rebound is relatively high, making it a better short-term buying opportunity; conversely, if the PSY indicator percentage value is greater than 90, it is extremely overbought. This is a favorable short-term selling opportunity.
5. When the PSY curve and PSYMA curve are both running upwards, it is a buying opportunity; conversely, when the PSY curve and PSYMA curve are both running downwards, it is a selling opportunity. When the PSY curve breaks upwards through the PSYMA curve, it is a buying opportunity; conversely, when the PSY curve falls below the PSYMA curve, it is a selling opportunity.
6. When the PSY curve breaks upwards through the PSYMA curve, and then starts to retrace downwards towards the PSYMA curve, as long as the PSY curve does not fall below the PSYMA curve, it indicates that the stock price is undergoing a strong consolidation. Once the PSY curve turns upwards again, it is a buying opportunity; when the PSY curve and PSYMA curve are both running upwards for a period of time, and the PSY curve moves far away from the PSYMA curve, once the PSY curve turns downwards, it indicates that the upward momentum of the stock price is depleted, which is a selling opportunity.
7. When the PSY curve and PSYMA curve both extend upwards again, investors should hold their stocks for the rise; when the PSY curve runs below the PSYMA curve, investors should hold and wait.
8. When the PSY curve and PSYMA curve are always intertwined, moving within a small range of fluctuation, it indicates that the stock price is in a consolidation pattern, and investors should primarily adopt a wait-and-see approach.
3. The parameter N is set to 12 days, and the parameter M is set to 6 days.
Judgment Criteria
The psychological line PSY indicator is a medium-term technical analysis indicator in the stock market, which mainly reflects the overbought or oversold psychological state of investors in the market. It is suitable for determining the general trend and can also be used to analyze individual stock trends. It plays a significant role in measuring investors' psychological tolerance and the rise and fall of market sentiment. It is an auxiliary indicator that reflects market energy in stock market technical analysis.
In stock market technical analysis software, the general analysis criteria for the PSY indicator mainly revolve around the values of the PSY indicator, the overbought and oversold situations of PSY values, the trend of the PSY curve, and the shape of the PSY curve. For example, in the daily cycle standard, specific analysis is as follows:
Value situation
1. The value of the PSY indicator always falls between 0 and 100. A value of 0 is the lower limit of the PSY indicator, while 100 is the upper limit. A value of 50 acts as the dividing line between bulls and bears.
2. A PSY value greater than 50 represents the bullish zone of the PSY indicator, indicating that the number of days with rising prices in the last N days exceeds the number of days with falling prices. Bulls dominate, and investors can hold stocks for potential gains.
3. A PSY value less than 50 signifies the bearish zone of the PSY indicator, suggesting that the number of days with rising prices in the last N days is less than the number of days with falling prices. Bears dominate, and investors should consider holding off on making decisions.
4. When the PSY hovers around 50, it reflects that the recent days of stock index or stock price increases are approximately equal to the days of decreases. Bullish and bearish forces remain balanced, and investors are advised to adopt a wait-and-see approach.
Overbought and oversold situation
1. Typically, PSY values fluctuate between 25 and 75, indicating that stock prices are in a normal state of volatility. Investors can continue to trade stocks based on their original strategies.
2. In a consolidation scenario, the PSY indicator should hover around the midpoint of 50, with upper and lower boundaries usually set at 25 and 75 (some may set them at 30 and 70). This suggests that bulls and bears are generally in a state of balance. If the PSY deviates from this equilibrium level, it indicates overbought or oversold conditions.
When the PSY reaches or exceeds 75. It indicates that within N days, the number of rising days is far greater than the number of falling days, the bullish strength is very strong and persistent. However, from another perspective, due to the large number of rising days, there are also many profit-taking positions in stocks, the market shows signs of overbuying, especially in the case of large price increases, the pressure on the stock price to rise will be high, and the stock price may quickly fall back for adjustment, investors should pay more attention.
When the PSY reaches or falls below 25, it indicates that within N days, the number of falling days is far greater than the number of rising days, the bearish force is relatively strong, and there is a strong pessimistic atmosphere in the market, causing the stock price to decline all the way. But from another perspective, due to the large number of falling days, the market shows signs of overselling, especially in the case of large price declines, there are few sell-offs in the market, the selling pressure is light, and the stock price may rebound upwards.
If the PSY value appears to be greater than 90 or less than 10 in such extreme overbought or oversold situations, investors should pay even more attention.
In the early stages of a bull market and a bear market, the overbought and oversold lines can be adjusted to 85 and 15, and then adjusted back to 75 and 25 in the later stages of market development, which is more conducive to the analysis of the PSY indicator.
Trend Situation
The PSY indicator in stock market analysis software can also determine the trend direction of the stock market through its trend characteristics. The trend characteristics reflected by the PSY indicator mainly include no trend, upward trend, and downward trend in three aspects.
1. No trend
The lack of trend in the PSY indicator refers to the PSY value oscillating up and down between 40 and 60, indicating that the recent balance of bullish and bearish forces is relatively equal, with stock prices fluctuating in a relatively balanced manner. Reflected on the PSY curve chart as the PSY curve moving slightly up and down or forming a horizontal line in the 40-60 range. At this time, investors should adopt a wait-and-see attitude, and make buy and sell decisions after a trend is established.
2. Upward trend
There are two situations of upward trend in the PSY indicator. One is that the PSY value is mostly above 50, even if occasionally slipping below 50, it will quickly rebound above 50 and climb upward. The other situation is that the PSY value starts below 50 and rises slowly to surpass 50, then climbs slowly upward. This indicates that the recent bullish momentum is stronger than bearish momentum, and the stock price rises all the way. These two situations are reflected on the PSY curve chart as a slow upward movement above the 50 line or an upward slanting curve climbing all the way up from below the 50 line. When the upward trend of PSY is formed, investors should actively buy stocks or hold for an increase until the trend changes.
3. Downtrend
There are also two situations of downward trend in the PSY indicator. One is that the PSY value is mostly below 50, and the other is that the PSY value starts above 50, then falls below 50 and continues to decline. This indicates that the bearish power is too strong, and the stock price drops all the way. Both situations indicate that the bearish momentum is stronger than bullish momentum, and the stock price declines continuously.
The sharp tool for determining extreme situations: Technical Indicator PSY (Psychological Line Indicator).
Disclaimer: Community is offered by Moomoo Technologies Inc. and is for educational purposes only. Read more
6
+0
1
See Original
Report
14K Views
Comment
Sign in to post a comment