US Equity Markets
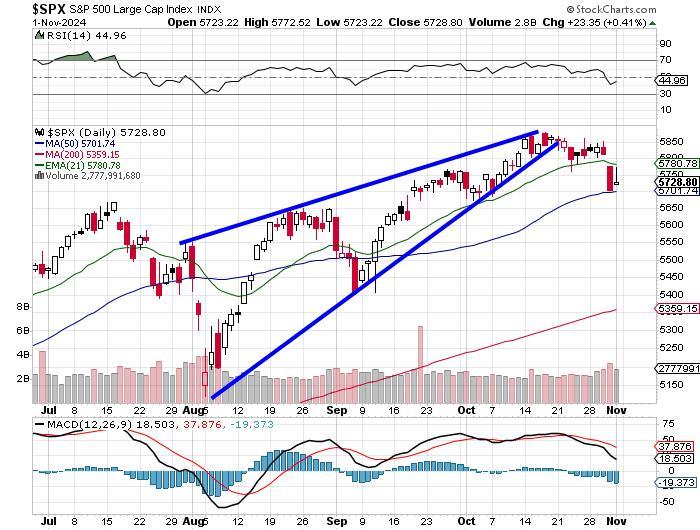
Do these charts look familiar to you guys? Hopefully, they have been core to our these for a couple of weeks now.

Readers will see that the S&P 500 has posted two successive "down" weeks as the daily MACD for that index rolled over. The S&P 500 closed at its 50-day SMA on Thursday and was able to make a stand there on Friday.

It's only one down week for the Nasdaq Composite. That ended a seven-week winning streak for this index. Here readers will see a less pronounced, but still bearish look for the daily MACD and an RSI that's still neutral. The fight here is around the 21-day EMA, which is less significant to portfolio managers (but perhaps more important to traders), thus impacting the flow of capital to a lesser degree.
Disclaimer: Community is offered by Moomoo Technologies Inc. and is for educational purposes only.
Read more
Comment
Sign in to post a comment
