2
Translated

2
Translated

1
1
8
1
$Advanced Micro Devices (AMD.US)$ $Super Micro Computer (SMCI.US)$ $Amazon (AMZN.US)$
Tonight we will analyze 3 stocks: amd, smci, and amazon
Let's start with amd. The CD indicator suggested a bottom-fishing opportunity on August 6th.
Next is the candlestick chart, where the closing price should not break below the blue ladder, and we should not sell at the lower edge.
Let's talk about smci. The interpretation video on Monday made everyone chase after it:
The CD indicator suggested bottom-fishing at 492. After I let everyone chase after it, as long as the blue ladder is above the yellow ladder, hold on to it:
Amazon:
(as stated in the previous picturesell和Buy lowThe CD indicator provides automatic prompts.
There is a high probability of the blue ladder rising above the yellow ladder.
Amazon is actually an AI stock, this perspective can be focused on:
The UK aviation regulator said on Thursday that it has selected six projects, including one from e-commerce giant Amazon (AMZN.O), to test the use of drones in delivery, infrastructure inspection, and emergency services. The UK Civil Aviation Authority (CAA) had earlier expressed its intention to allow more drones for such purposes. Currently, drone users in the UK can only operate beyond visual line of sight (BVLOS) under strict restrictions. These projects include Amazon's drone delivery service Prime Air, Airspection for inspecting offshore wind farms, and Project Lif, which aims to transport medical supplies.
Translated


+2
7
$NVIDIA (NVDA.US)$ $Faraday Future Intelligent Electric Inc. (FFIE.US)$ $Coinbase (COIN.US)$
Let's talk about Nvidia first:
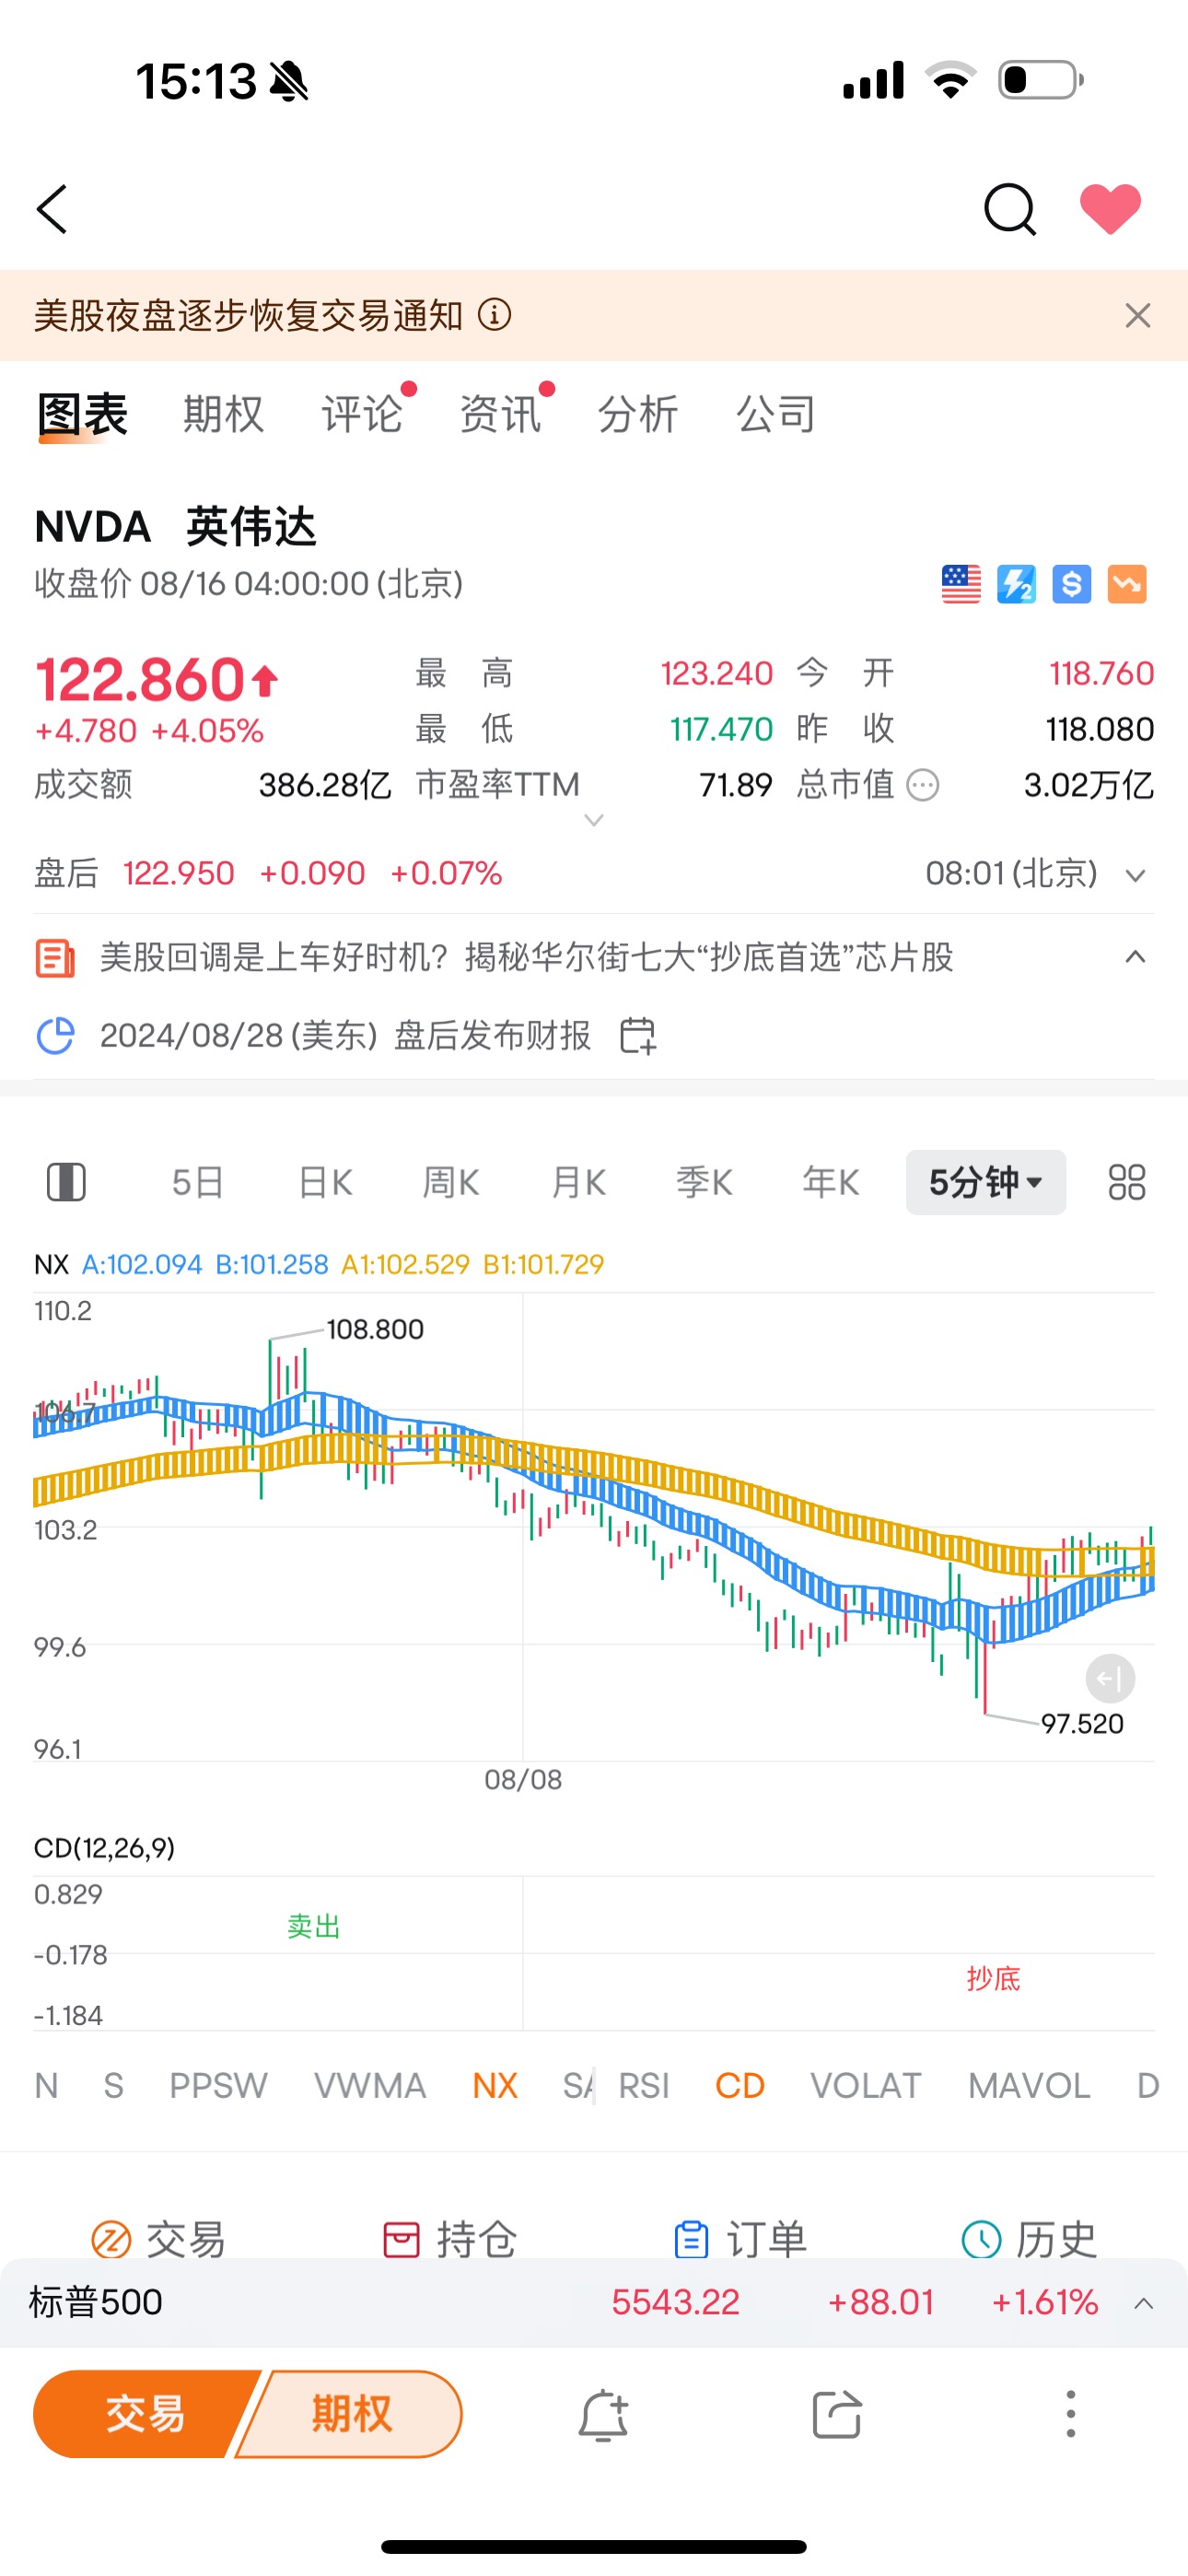
In the short term: The CD indicator on August 8 suggests that it is possible to break the bottom and strengthen. I said, it is possible to continue to work in the short term:
(The one pictured abovesellwithRead the bottom(It comes with the CD indicator)
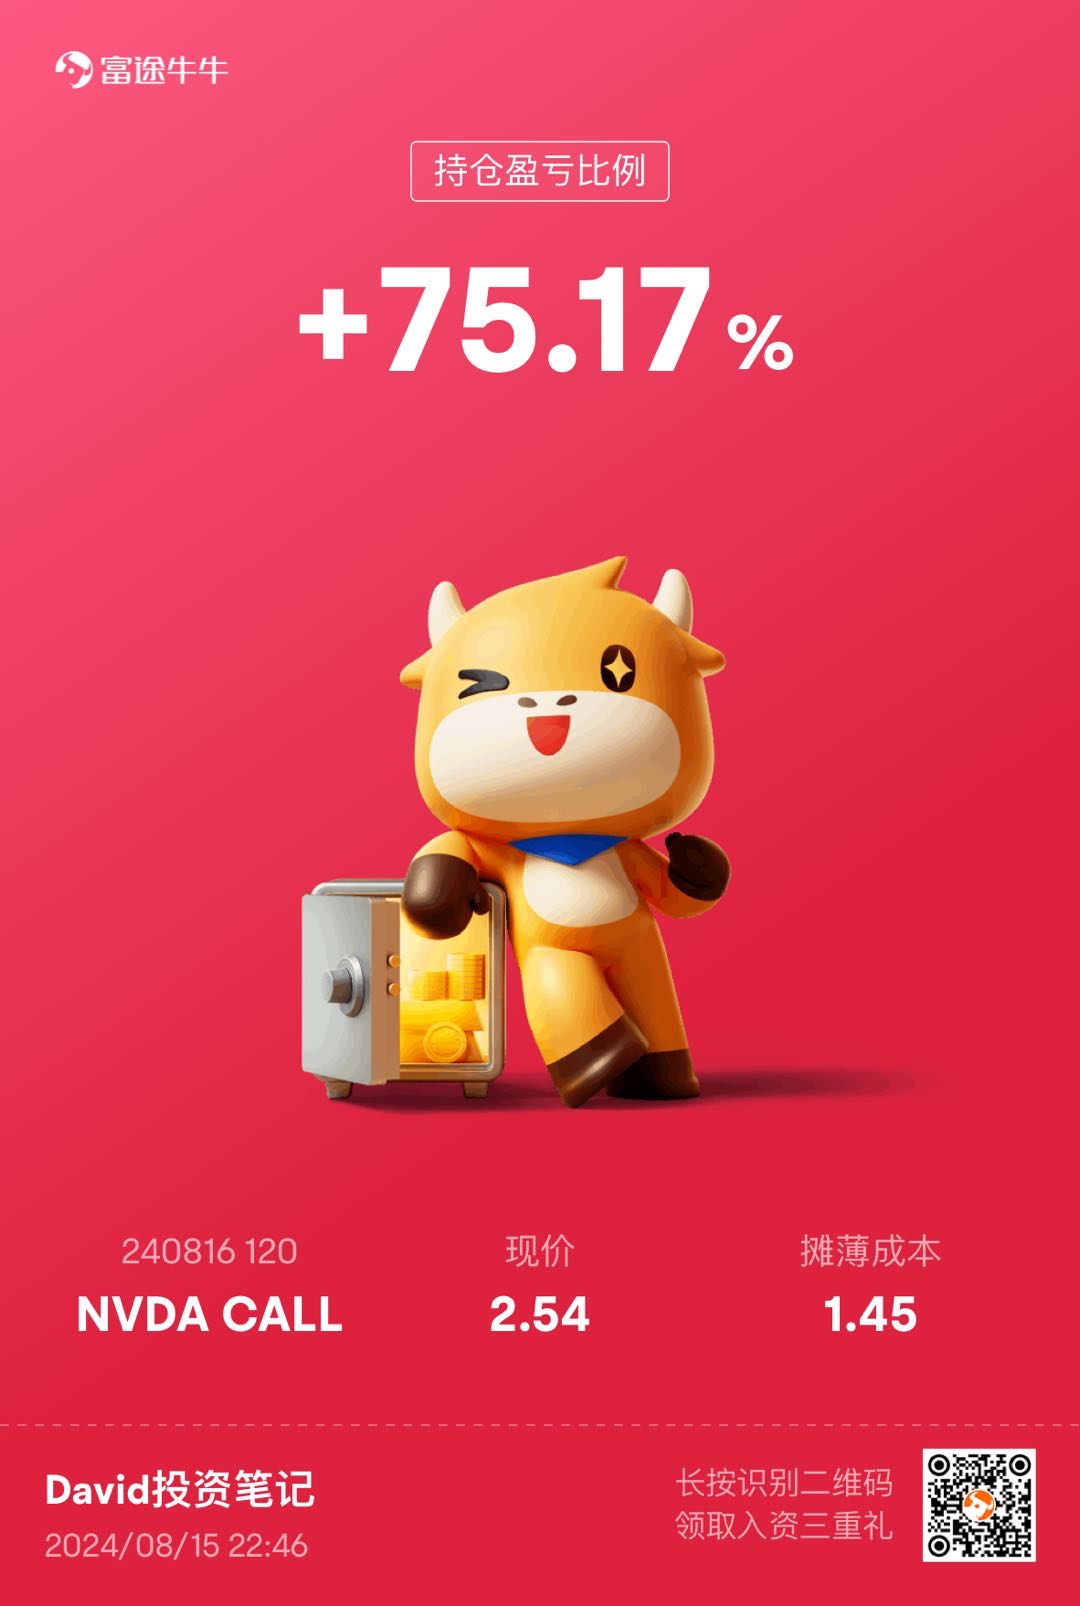
I made another one last night:
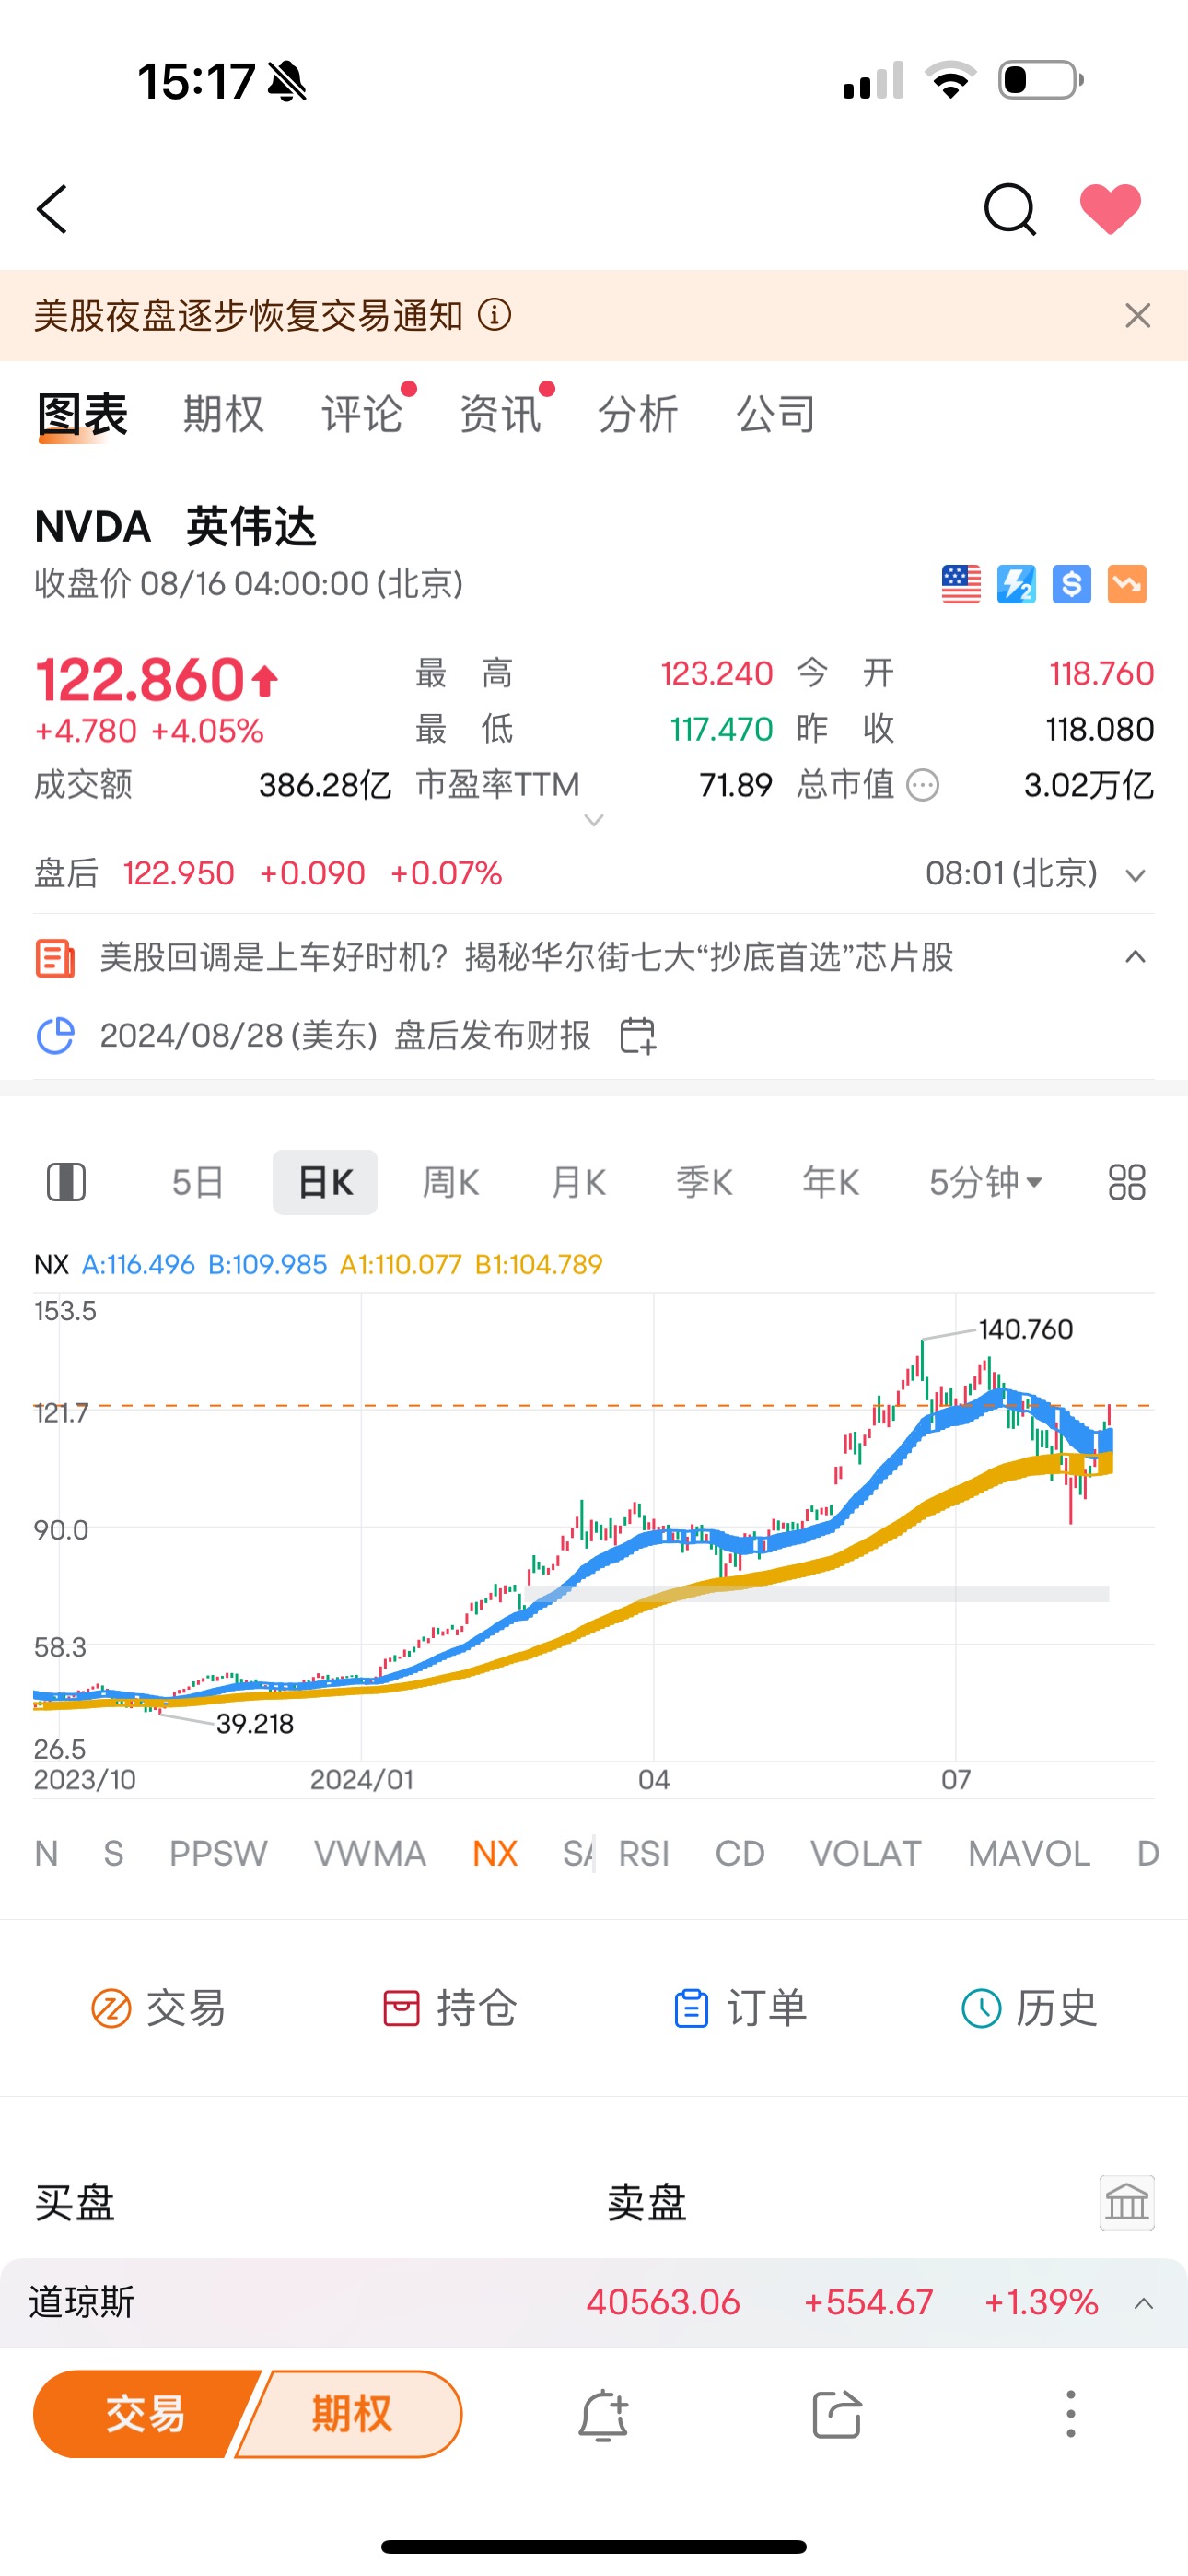
In the long run, Nvidia can hold the Japanese-level blue ladder as long as it remains above the yellow ladder:
In the case of Coinbase, the previous CD indicator at 70 suggests a bottom cut:
Zoom in as follows:
However, Bitcoin will skyrocket next, and short-term coins will rise.
I made it very clear in FFIE's explanation video on Monday. Clear out the warehouse first and leave. 4-hour level waiting to complete the bottom
I forgot to mention another question. When it comes to demon stocks, the technical term is meme stocks. Remember, you can only look at technical lines, not fundamentals. If the barking cat comes out again with rhythm, there will be another wave
Translated


+4
6
$Walmart (WMT.US)$ $Tesla (TSLA.US)$ $AST SpaceMobile (ASTS.US)$
First, let's talk about Walmart.
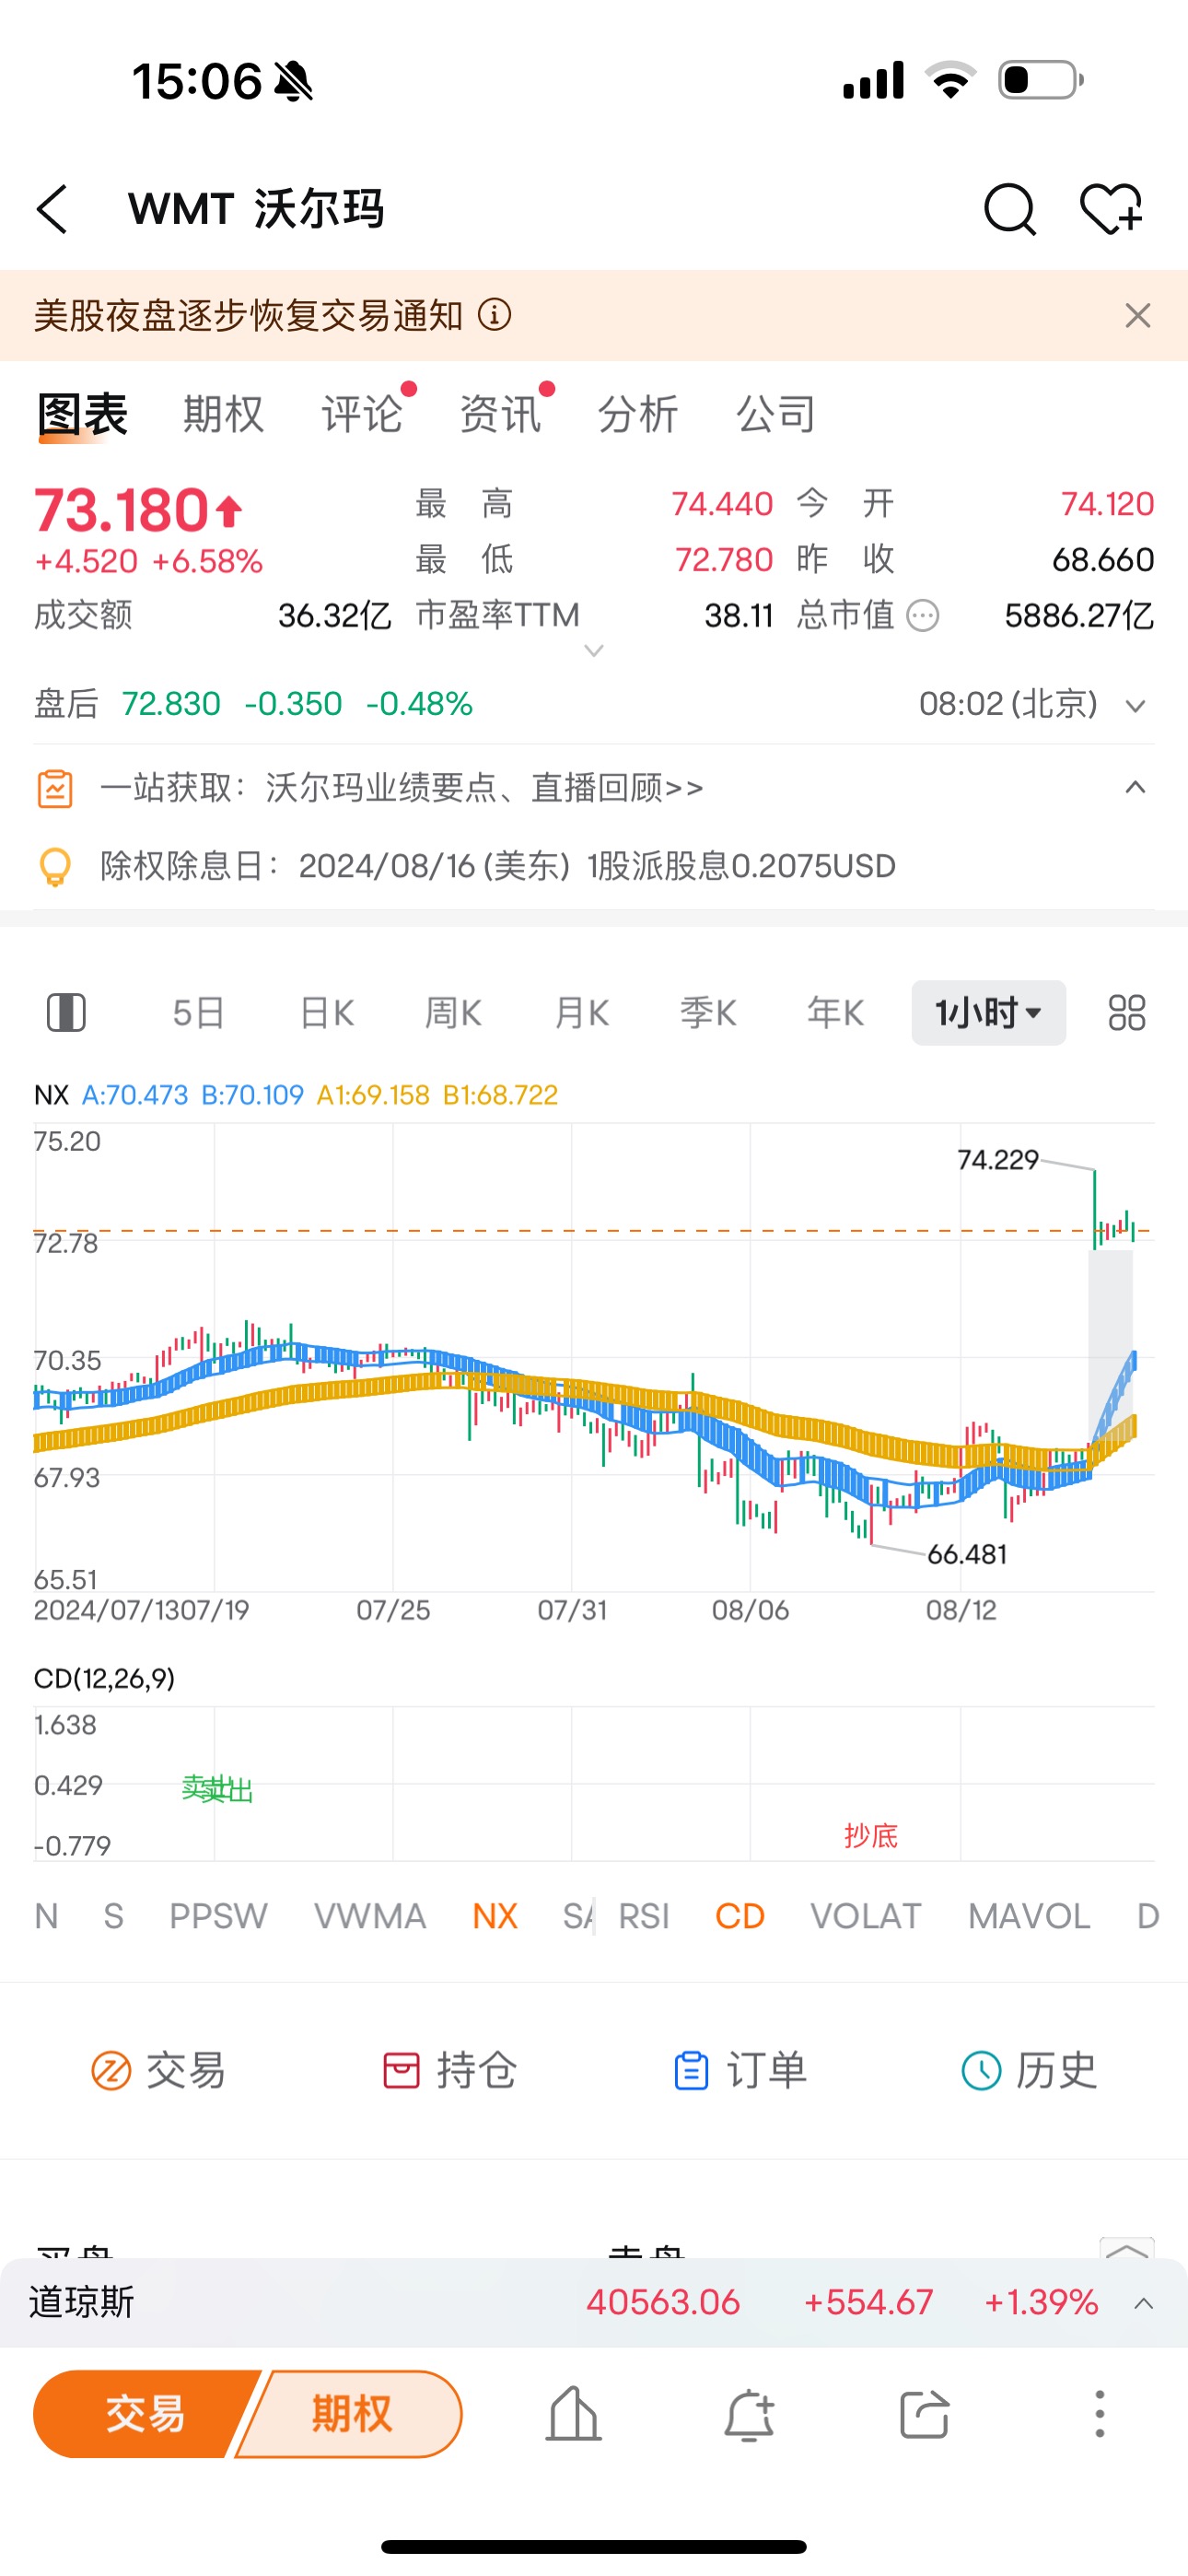
Revenue of $169.34 billion, a year-on-year increase of 4.8%, exceeding expectations. Based on this, the technical trend has bottom-picking indications from the CD indicators:
(Refer to the chart aboveBuy low和sellis a CD indicator by default
Next, one is for those who hold, if the closing price of the candlestick chart does not break the lower edge of the blue ladder, do not sell. Another is if you want to buy, wait for it to pull back to the lower edge of the blue ladder. I will provide detailed supplements in tonight's interpretation video.
CRWD will continue to rise.
Tesla, as I mentioned on Monday, there is already a bottom fishing opportunity on the hourly chart.
Do not sell until it breaks the lower edge of the blue ladder.
ASTS: The bottom fishing indicated by the CD indicator on April 17, do not sell when the closing price of the candlestick chart does not break the lower edge of the blue ladder.
Never broken before.
Then just hold it until it breaks.
Translated


+4
19
1


![[empty]](https://static.moomoo.com/node_futunn_nnq/assets/images/folder.5c37692712.png)
![[error]](https://static.moomoo.com/node_futunn_nnq/assets/images/no-network.991ae8055c.png)