mehdi zinati
liked
$YTL (4677.MY)$
1. Failed to break 20MA again in downtrend
2. Downbar with increasing volume
No reversal setup for YTL. Likely to drop below RM2.00 again
Disclaimer: This post is for informational purposes only. Always consult a financial advisor before making any investment decision
1. Failed to break 20MA again in downtrend
2. Downbar with increasing volume
No reversal setup for YTL. Likely to drop below RM2.00 again
Disclaimer: This post is for informational purposes only. Always consult a financial advisor before making any investment decision

6
4
plz setting tdi indicator gold chart
mehdi zinati
commented on
$iShares Semiconductor ETF (SOXX.US)$
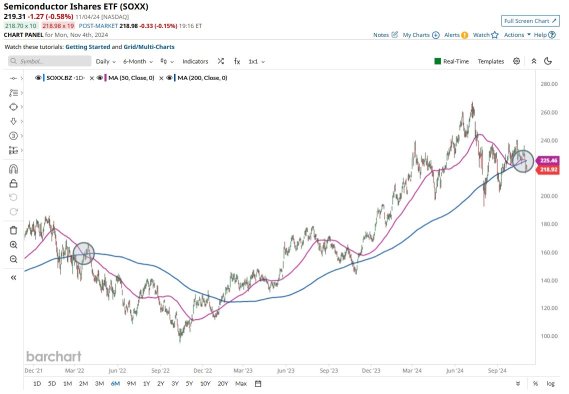
$SOXX forms a Death Cross for the first time since March 2022. The last one sent shares plummeting almost 40% over the next 7 months!
![]()
![]()
![]()
$SOXX forms a Death Cross for the first time since March 2022. The last one sent shares plummeting almost 40% over the next 7 months!

5
3
2
mehdi zinati
commented on
$WiMi Hologram Cloud (WIMI.US)$
Volume has increased on the last day along with the price, which is a positive technical sign, and, in total, 4 thousand more shares were traded than the day before. In total, 131 thousand shares were bought and sold for approximately $114.97 thousand.
The stock lies in the lower part of a very wide and strong rising trend in the short term, and this may normally pose a very good buying opportunity. If the lower trend floor at $0.85 is broken, it ...

1
1
mehdi zinati
commented on
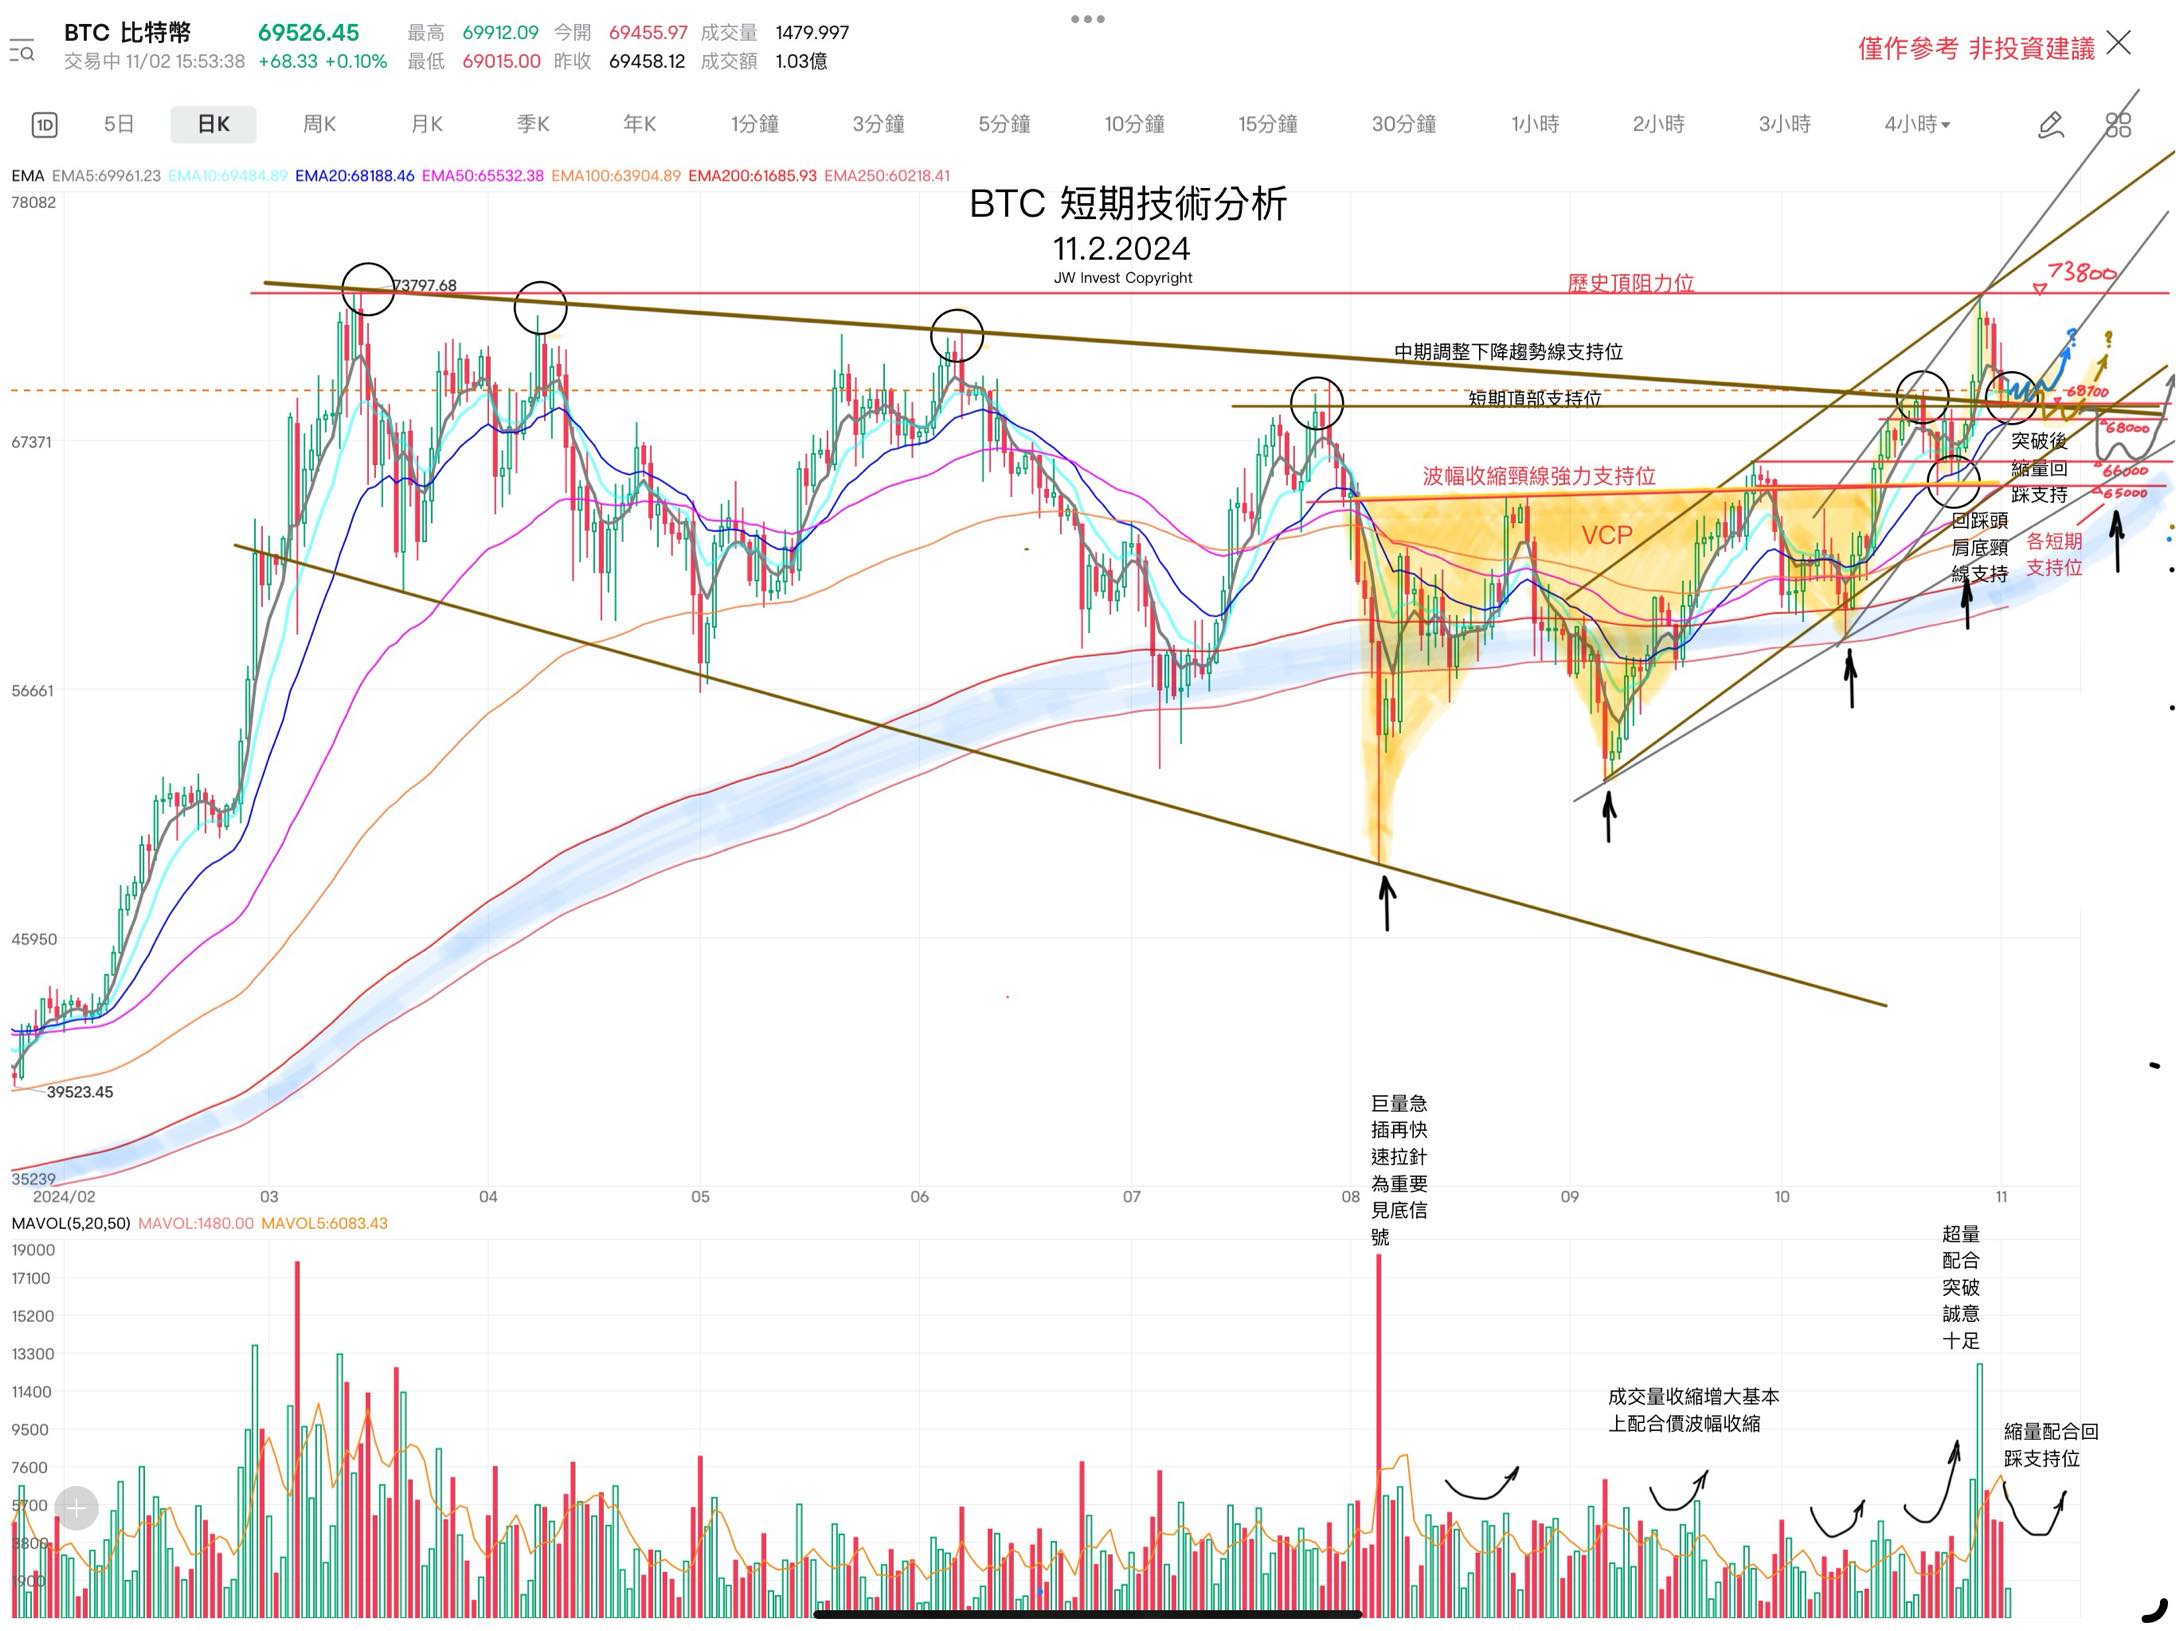
$Bitcoin (BTC.CC)$ So excited BTC has reached new high…have been condident that it has very strong supports at 65000-68000 based on detailed tech analysis
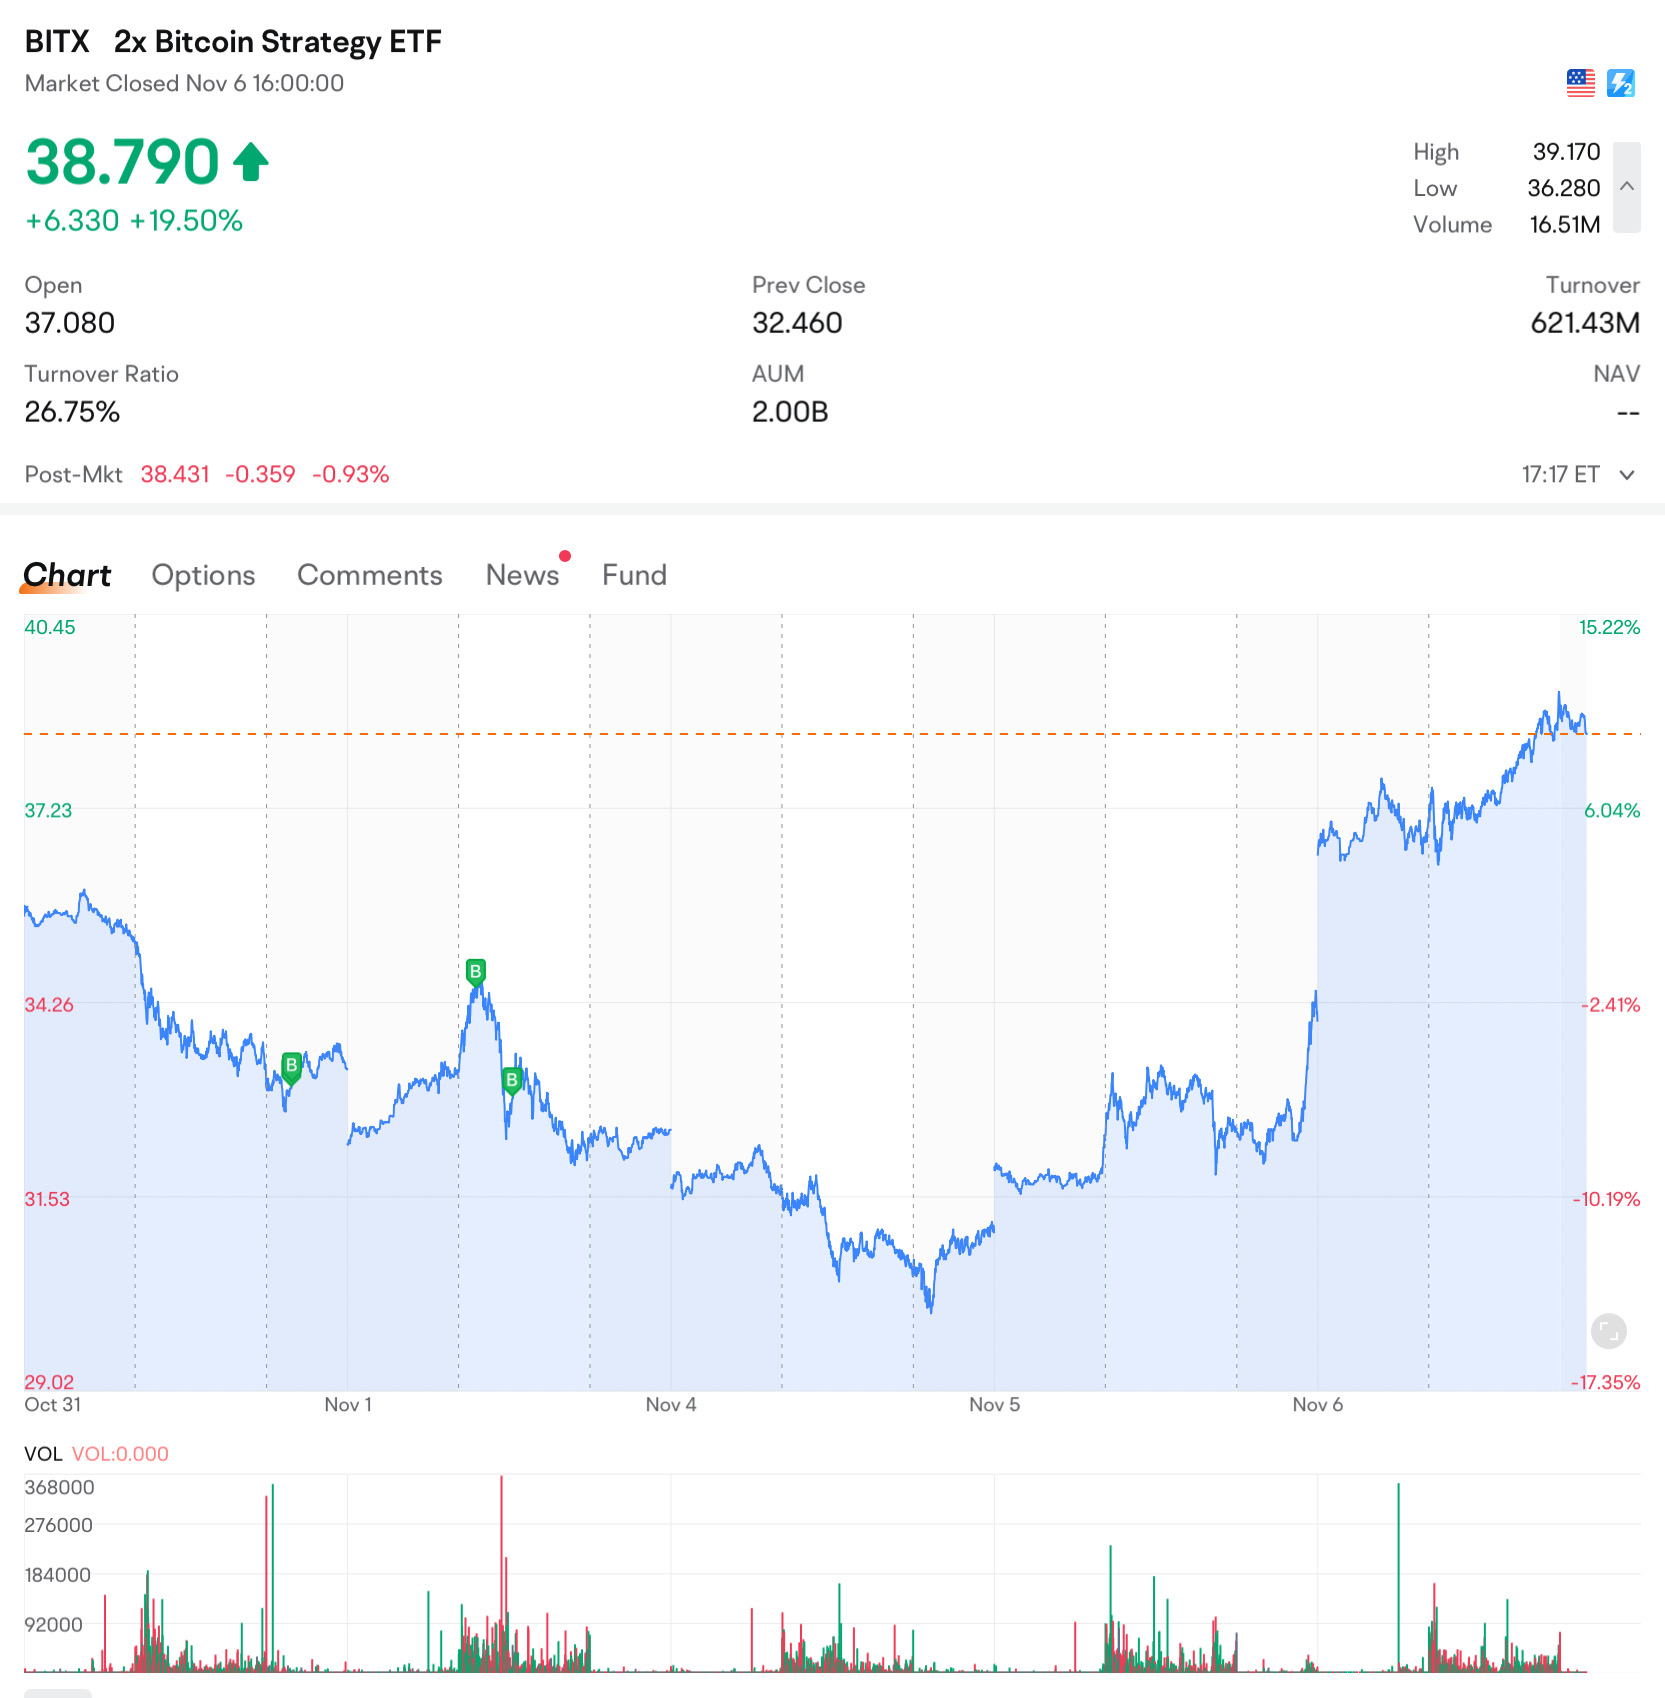
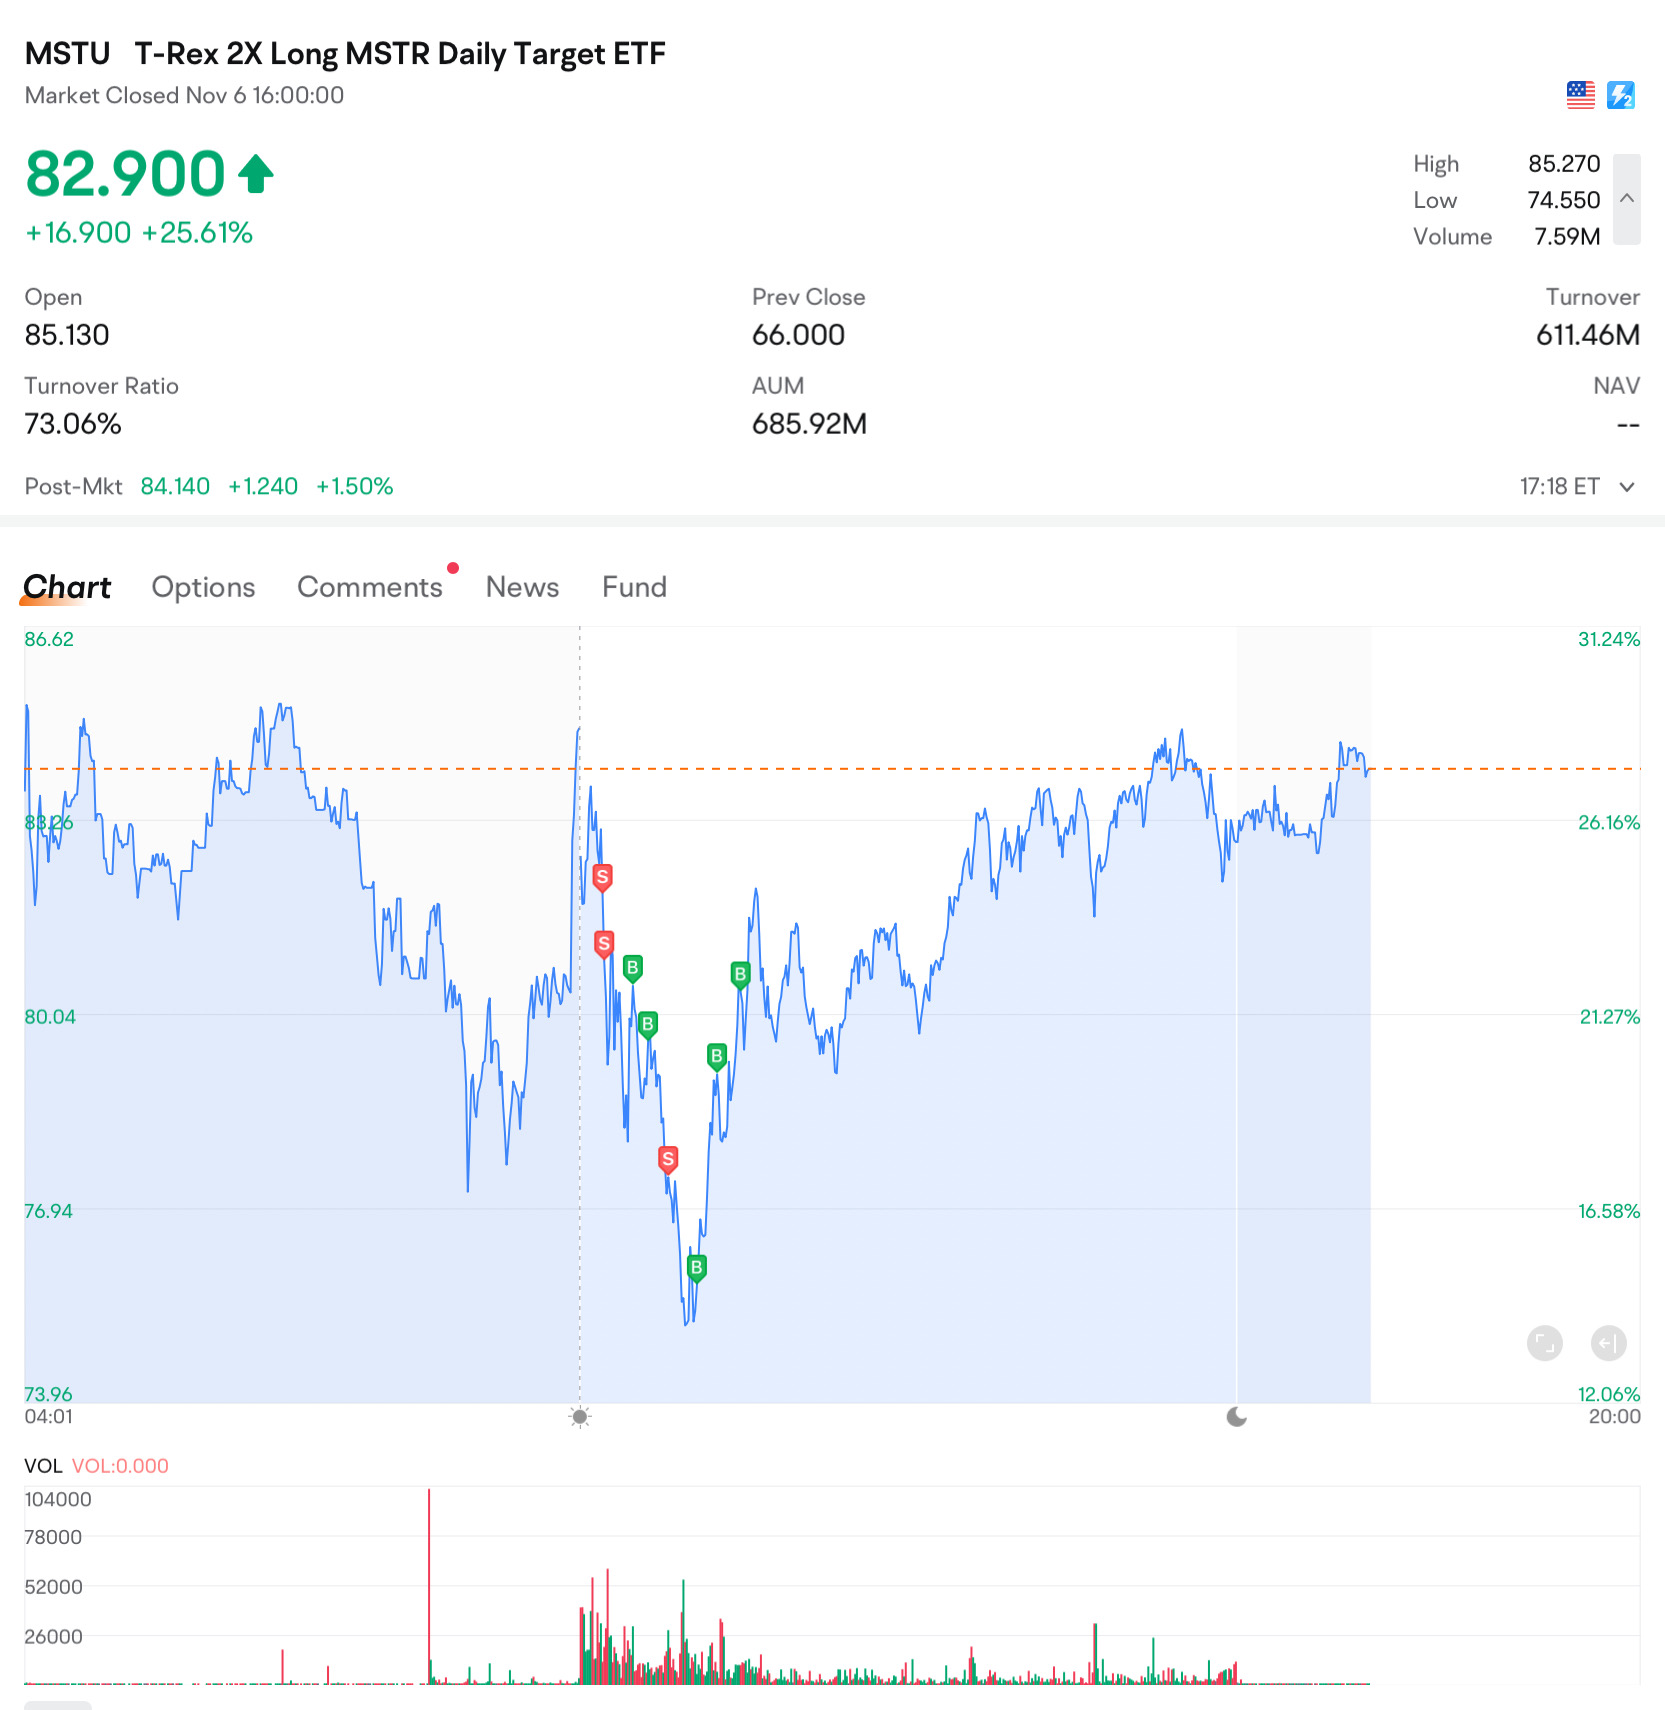
$2x Bitcoin Strategy ETF (BITX.US)$ $Strategy (MSTR.US)$ $T-Rex 2X Long MSTR Daily Target ETF (MSTU.US)$
$2x Bitcoin Strategy ETF (BITX.US)$ $Strategy (MSTR.US)$ $T-Rex 2X Long MSTR Daily Target ETF (MSTU.US)$


2
4
mehdi zinati
commented on


5
3
mehdi zinati
liked and commented on
$XAU/USD (XAUUSD.CFD)$ where is the direction it will go by seeing this 4h chart of RSI and chart trend? The downtrend still ranging at the mid channel line but the RSI already move out frm oversold region. Can it stay above the white MA line. Let see...🤔🤔

8
4
mehdi zinati
commented on
$RGTI another quantum name to watch...
Trying to break a two-year downtrend.
Heavy accumulation. And red hot theme! 🔥
1. Moving Averages (MA): The 20-day moving average (MA20) is at 1.17, and the 250-day moving average (MA250) is at 1.139. The price is currently above both moving averages, which might indicate a short-term upward trend.
2. Bollinger Bands: The chart includes Bollinger Bands set at 20 periods with a standard deviation of 2. The current price is close to the upper band (1...

2
1


![[empty]](https://static.moomoo.com/node_futunn_nnq/assets/images/folder.5c37692712.png)
![[error]](https://static.moomoo.com/node_futunn_nnq/assets/images/no-network.991ae8055c.png)