ninjainvest
liked
$OCBC Bank (O39.SG)$ $Great Eastern (G07.SG)$ OCBC has made a S$1.4 billion voluntary unconditional general offer for the 11.56,% stake in Great Eastern Holdings that it does not currently own, with the aim to delist its insurance arm.
The offer price of S$25.60 represents 36.9% premium over Great Eastern’s last traded price of S$18.70. 发了
The offer price of S$25.60 represents 36.9% premium over Great Eastern’s last traded price of S$18.70. 发了
14
25
ninjainvest
liked
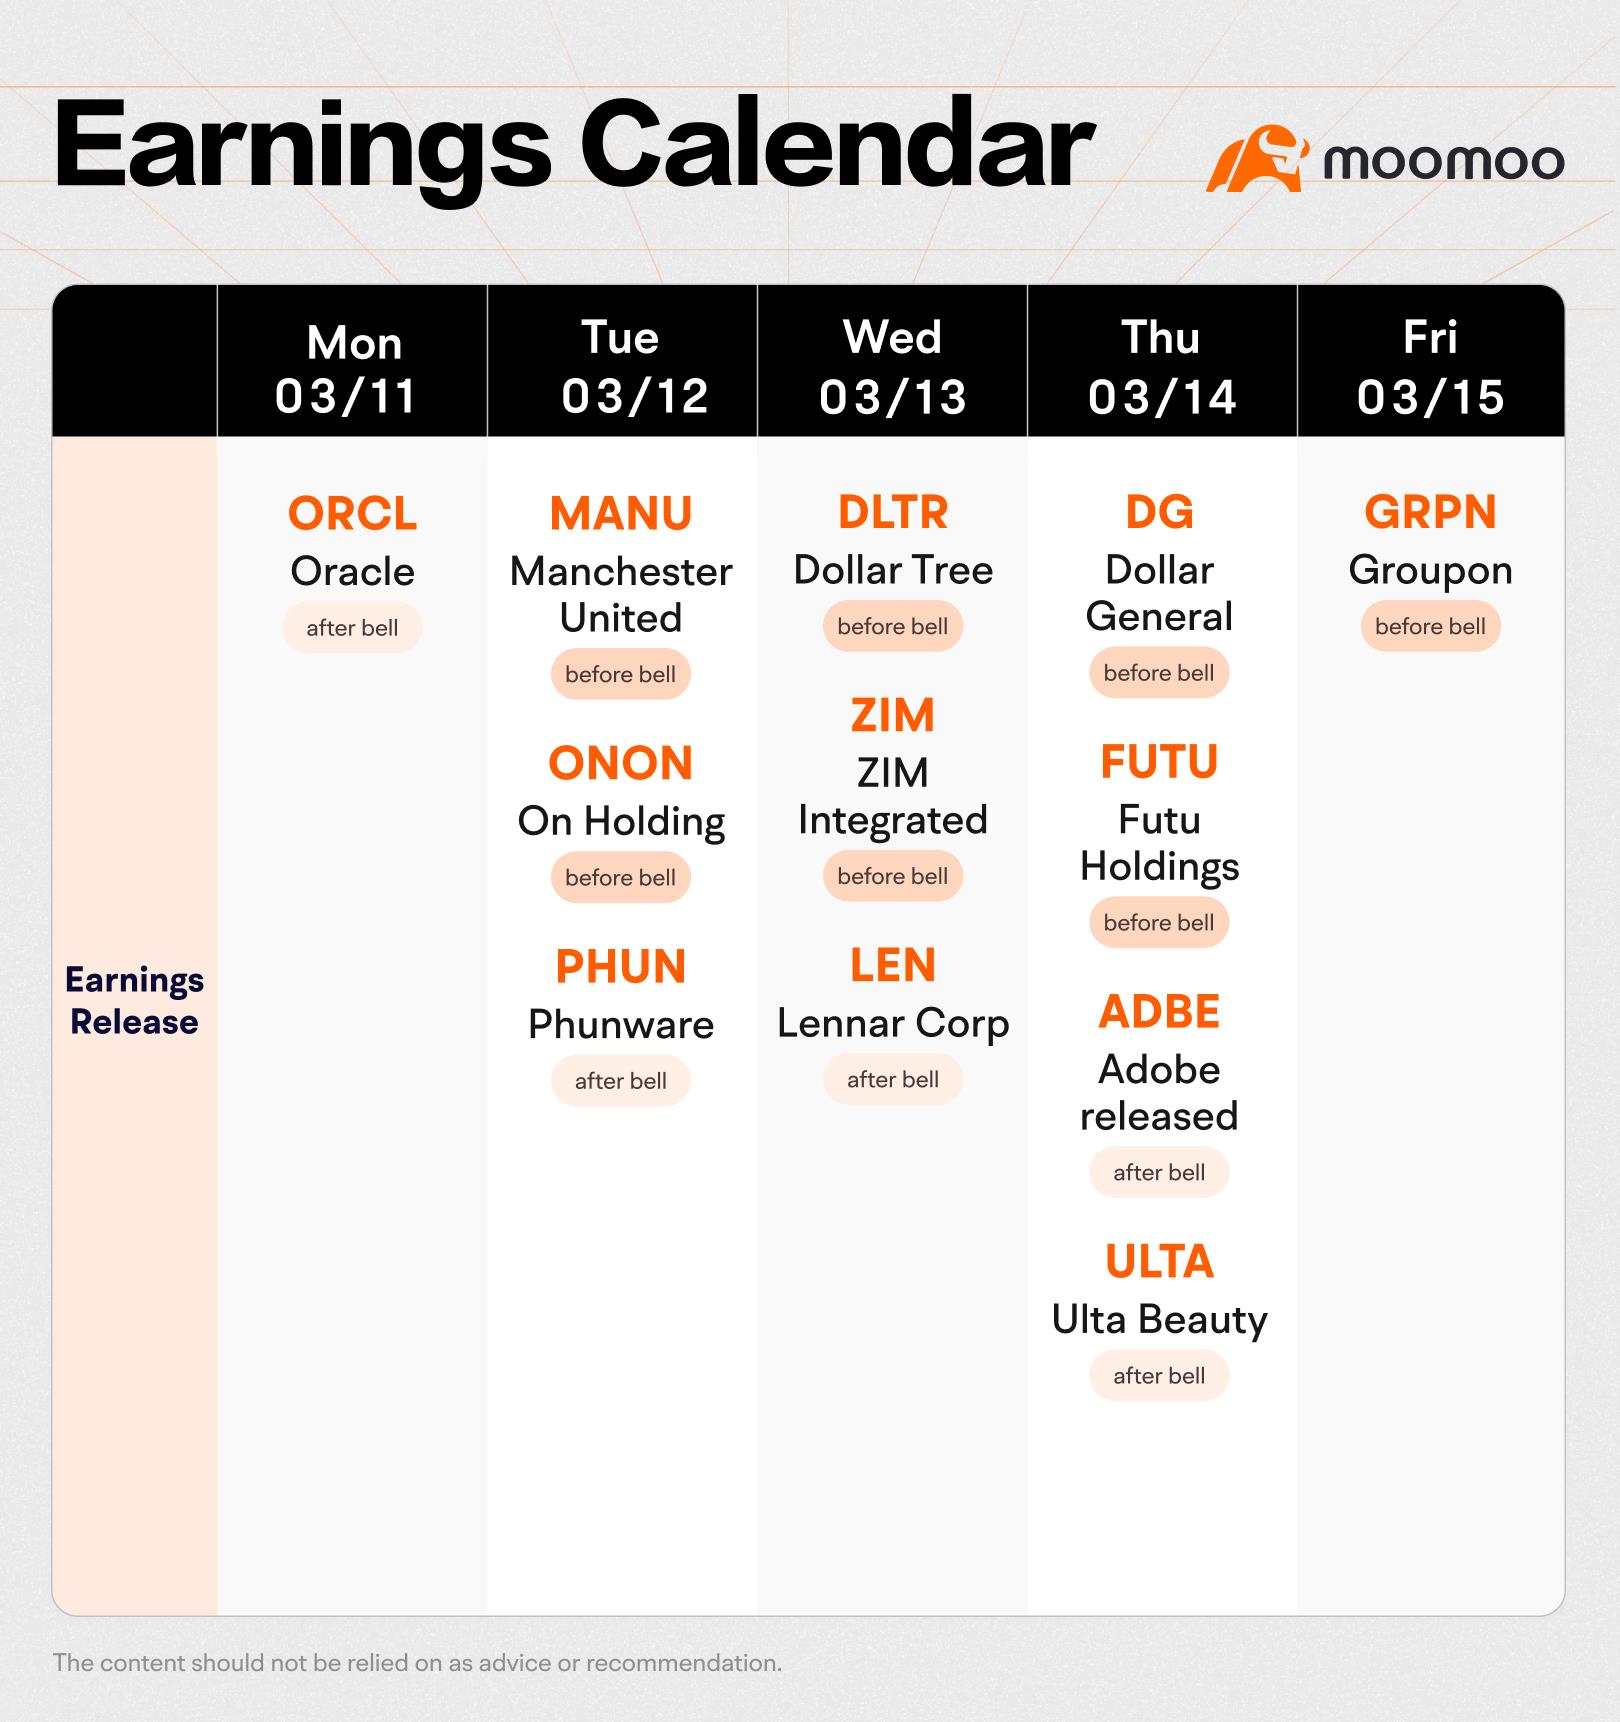
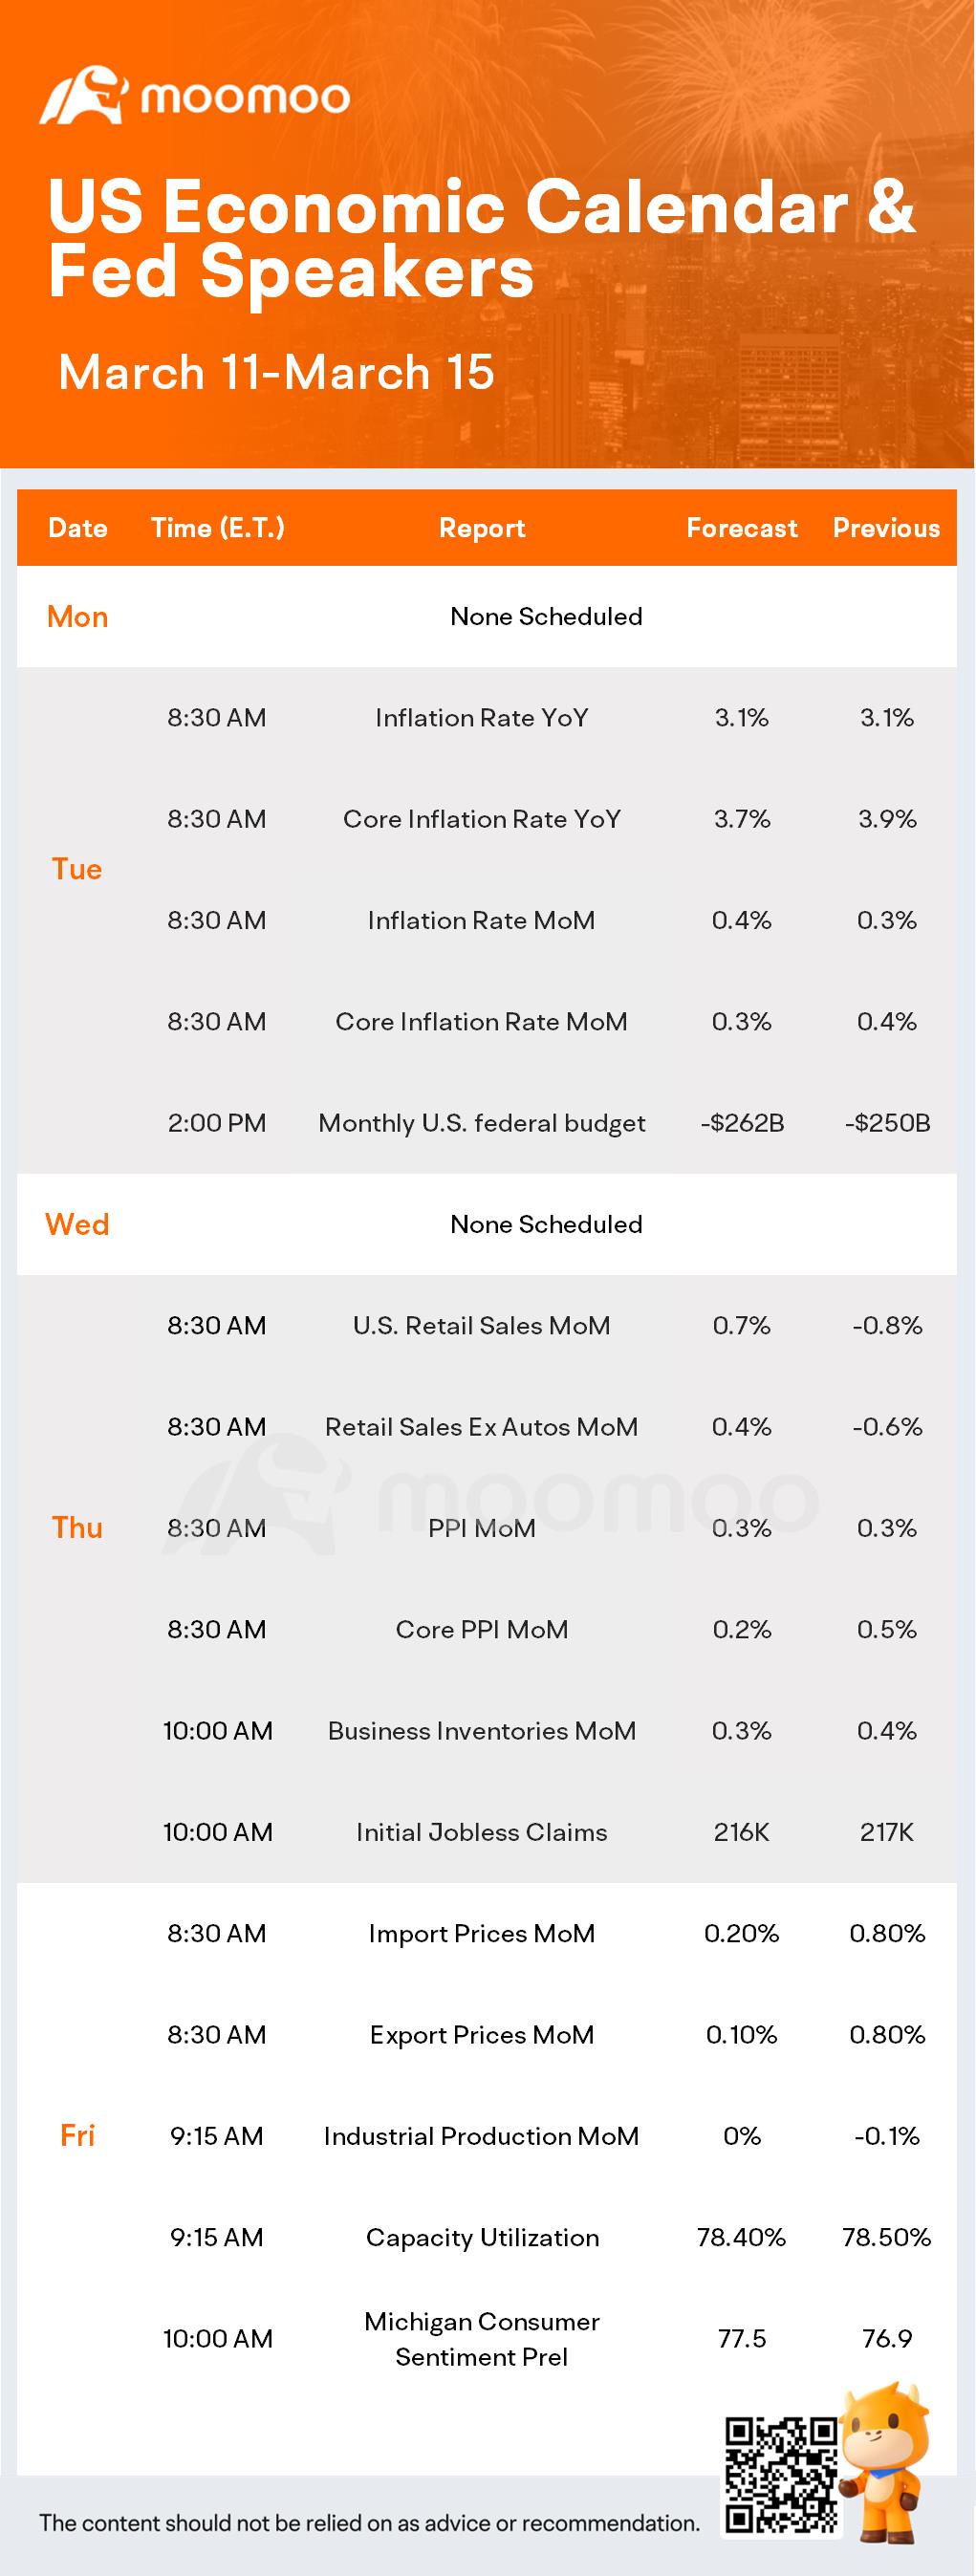
The upcoming week in the financial markets is poised for scrutiny as earnings reports and pivotal economic indicators are set to be released.
Monday will see $Oracle (ORCL.US)$ set the tone for the week, followed by a suite of announcements from $Manchester United (MANU.US)$, $On Holding (ONON.US)$, and $Phunware (PHUN.US)$ on Tuesday. Wednesday's lineup features $Dollar Tree (DLTR.US)$, $ZIM Integrated Shipping (ZIM.US)$, and ����...
Monday will see $Oracle (ORCL.US)$ set the tone for the week, followed by a suite of announcements from $Manchester United (MANU.US)$, $On Holding (ONON.US)$, and $Phunware (PHUN.US)$ on Tuesday. Wednesday's lineup features $Dollar Tree (DLTR.US)$, $ZIM Integrated Shipping (ZIM.US)$, and ����...


+3
67
ninjainvest
voted
In the past week, from a macro level, there are two major events that give investors further optimistic confidence.
First, the market believes that the Federal Reserve suspended the rate hike in June, and has got the corresponding information from FOMC members.
First of all, Powell's starting point is that the tightening of credit conditions caused by the banking crisis has already played a tightening role to a certain extent, so he s...


+1
4
ninjainvest
voted
- White House, Republicans resume US debt ceiling talks
- Stocks hold declines after release of Fed minutes
- $Citigroup (C.US)$ drops after scrapping Mexico unit sale
- Indexes down: $Dow Jones Industrial Average (.DJI.US)$ 0.77%, $S&P 500 Index (.SPX.US)$ 0.73%, $Nasdaq Composite Index (.IXIC.US)$ 0.61%
The lack of progress on raising the U.S. government's $31.4 trillion debt limit ahead of a June 1 deadline, with several rounds of inconclusive talks, ...
From YouTube
15
ninjainvest
liked
$LAPCO HOLDINGS (08472.HK)$ Initially, the scammer asked me how much capital to invest, with a 500% profit, I said down⬇️80%, is 0.04 million enough?![]()
Translated
2
4
ninjainvest
voted
Chinese stocks surged Wednesday to their best day since 2008.
$Alibaba (BABA.US)$, $JD.com (JD.US)$, $Baidu (BIDU.US)$ other Chinese stocks bounced off multiyear lows.
On Wednesday, the $Hang Seng TECH Index (800700.HK)$ logged its biggest daily gain of 22%. The flagship $Hang Seng Index (800000.HK)$ climbed 9.1%, its largest one-day percentage increase since late 2008.
![]() Did you grab the chance and buy the dip a bit earlier?
Did you grab the chance and buy the dip a bit earlier?
![]() If you didn't, did you "FOMO"?
If you didn't, did you "FOMO"?
![]() After such a co...
After such a co...
$Alibaba (BABA.US)$, $JD.com (JD.US)$, $Baidu (BIDU.US)$ other Chinese stocks bounced off multiyear lows.
On Wednesday, the $Hang Seng TECH Index (800700.HK)$ logged its biggest daily gain of 22%. The flagship $Hang Seng Index (800000.HK)$ climbed 9.1%, its largest one-day percentage increase since late 2008.

31
4
ninjainvest
liked
Sometimes Wall Street pros refer to an event known as a "breakout." For those unfamiliar with the term, here is what it means and why it matters to investors.
What is a "breakout"?
A breakout refers to a pattern in a price chart where the price of a stock (or other traded asset) breaches a previously unbroken level or a level that hasn't been breached in a long time, says JC Parets, founder of technical-analysis service AllStarCharts.com.
Put simply, the price has "broken out" of a previously defined trading range....


81
27
ninjainvest
liked
1. Introduction
The SAR (stop and reverse) indicator is similar to a moving average in that it is also an analysis tool that emphasizes both price and time. It is a popular indicator that is mainly used by traders to determine the future short-term momentum of a given asset.
The indicator uses a trailing stop and reverse method abbreviated to "SAR" to determine favorable exit and entry points. Sometimes the indicator is also called Parabolic SAR as the graph is presented in a way that resembles a parabola....


+3
92
15
ninjainvest
liked
1. Introduction
Deviation rate (BIAS) is an indicator that reflects the degree of deviation between the stock price and its moving average in a certain period. It is calculated in terms of percentage difference.
When the stock price moves drastically to deviate from the trend, the possibilities for a pullback or rebound increase; When the stock price movement does not deviate from the trend, it is likely that the trend will continue.
By connecting BIAS values into a polyline, a deviation rate (BIAS) graph can be plotted to facilitate making trading decisions.
...


+2
136
12
ninjainvest
liked
In the previous article, we discussed about " How to understand basic candlestick charts?". In this article, we will show you ways to customize technical indicators in the charts.
Moomoo provides a wealth of technical indicators, for example, MA-moving average, BOLL-bollinger bandwidth and so on. Now see how you can customize indicators in moomoo mobile App and desktop.
1. Mobile App
1.1 In portrait mode, click on the sub-picture to switch indicators.
...
Moomoo provides a wealth of technical indicators, for example, MA-moving average, BOLL-bollinger bandwidth and so on. Now see how you can customize indicators in moomoo mobile App and desktop.
1. Mobile App
1.1 In portrait mode, click on the sub-picture to switch indicators.
...


+3
195
25

![[empty]](https://static.moomoo.com/node_futunn_nnq/assets/images/folder.5c37692712.png)
![[error]](https://static.moomoo.com/node_futunn_nnq/assets/images/no-network.991ae8055c.png)