Uranium is glowing brighter than ever! 🌍 With global momentum shifting toward clean energy, nuclear power is leading the charge. Stocks like $UEC are riding the wave as nations prioritize energy security and sustainability. The future is nuclear, and it’s here to stay! ⚛️🚀
Based on the current chart, a bullish price objective for Uranium Energy Corp ($UEC) could target $9.25–$9.50 in the short to medium term. This target aligns with:
1. Bollinger Bands: The price is nearing the upper band...
Based on the current chart, a bullish price objective for Uranium Energy Corp ($UEC) could target $9.25–$9.50 in the short to medium term. This target aligns with:
1. Bollinger Bands: The price is nearing the upper band...

5
🚀 GRAB is on fire! Just broke through key levels with strong volume. Holding $5.50 calls for December — this rally looks far from over. Eyes on $6+ as momentum stays red hot! 📈🔥

5
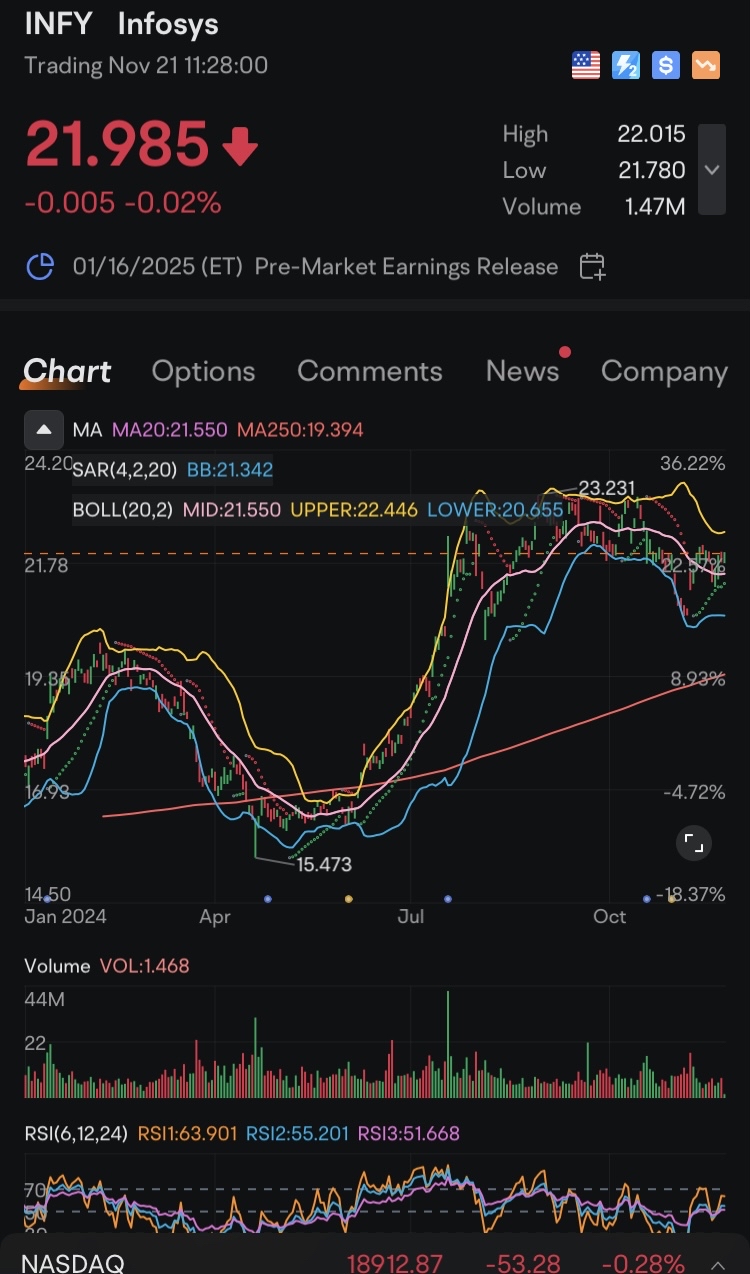
INFY looks strong above $21.55 (20-day MA), with support at $21.78 and bullish signals from Parabolic SAR and RSI near 64. Eyes on resistance at $22.45—breakout potential brewing! Long-term trend intact above 250-day MA at $19.39. 🚀📈

4
“🚀 $MARA on fire! Up 11.6% today, breaking key resistance with massive volume. Riding the Bitcoin wave and smashing past the 20 & 250 MA. Next stop: $30? Bulls in full control! 💹🔥

3
🚀 $RGTI is heating up! Closing at $1.35 (+3.05%) with pre-market momentum to $1.44 (+6.67%). Volume soaring, RSI strong at 60+, and riding above key MAs. Quantum computing is the future, and Rigetti is making waves! 🌐📈

1
1
🔥 $QBTS is on fire! 🚀 Up 12% today, breaking above MA20 & MA250 with heavy volume. Bollinger Bands tightening, RSI strong at 61 – momentum is building for a potential breakout! Quantum computing revolution is just getting started. 🧠💡

2
3
Price Overview:
• Last Closing Price: $5.66, up +3.66% from the previous session.
• Daily Range:
• High: $5.67
• Low: $5.40
• Post-Market Price: Unchanged at $5.66.
• The price has recently made a strong upward move, trading near its high for the day.
Key Technical Indicators:
1. Moving Averages (MA):
• 20-day MA: $4.477
• 250-day MA: $3.468
• The price is significantly above both the 20-day and 250-day moving averages, suggesting a strong bullish trend.
2. Bollinger Bands (...

13
“🚀 MARA on fire! Up 13.95% to $22.63 and surging +4.11% in pre-market to $23.56! Heavy volume & Bitcoin’s record rally fueling the breakout. Above key MAs, with eyes on $24.70 resistance. Bulls are charging! 🌟📈

4
2
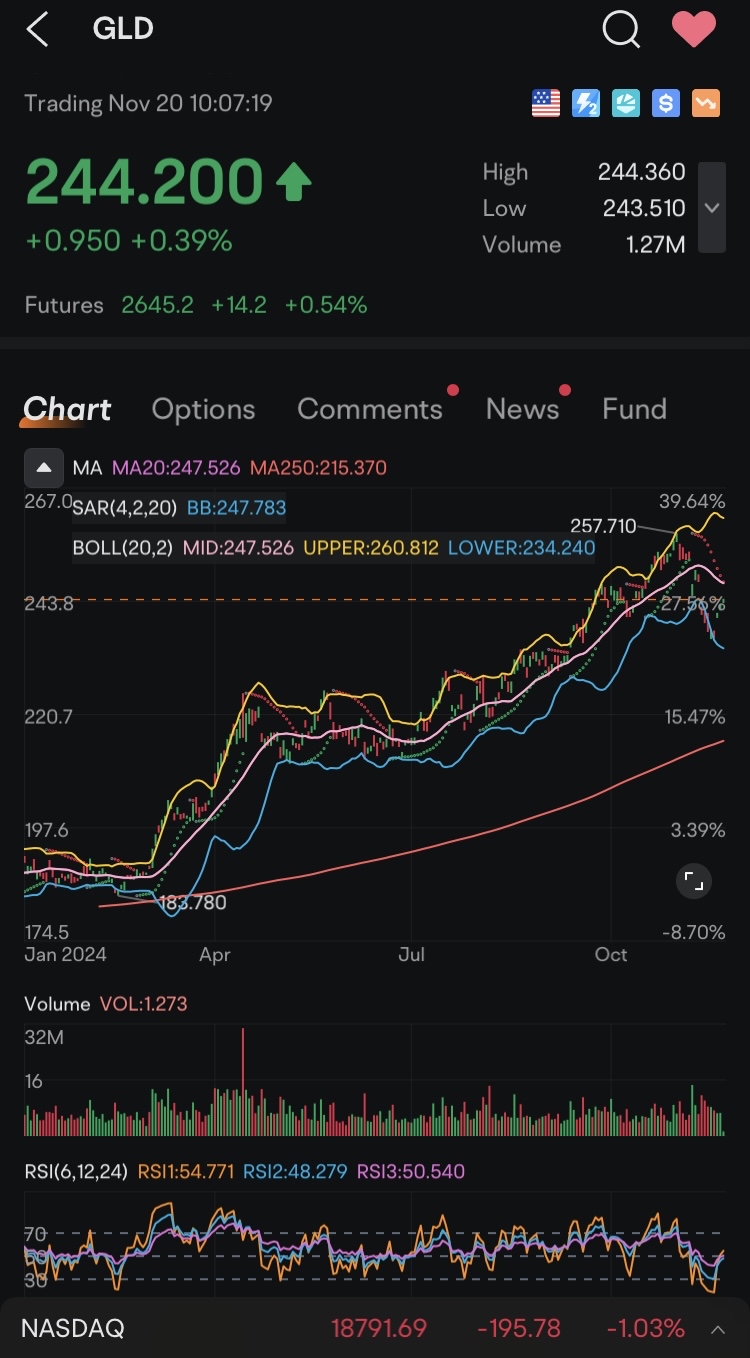
Gold $GLD) holding strong at $244 despite recent pullback! 🌟 With rising geopolitical tensions and central banks continuing to stockpile gold reserves, the metal’s safe-haven appeal is shining. Eyes on $260 resistance for the next breakout!

1
$IONQ showing unstoppable momentum! 🚀 Breaking past $30 with high volume and RSI in overbought territory—this quantum computing leader is gaining serious traction. Next resistance around $35-$40? Bulls are in control!

2

![[empty]](https://static.moomoo.com/node_futunn_nnq/assets/images/folder.5c37692712.png)
![[error]](https://static.moomoo.com/node_futunn_nnq/assets/images/no-network.991ae8055c.png)