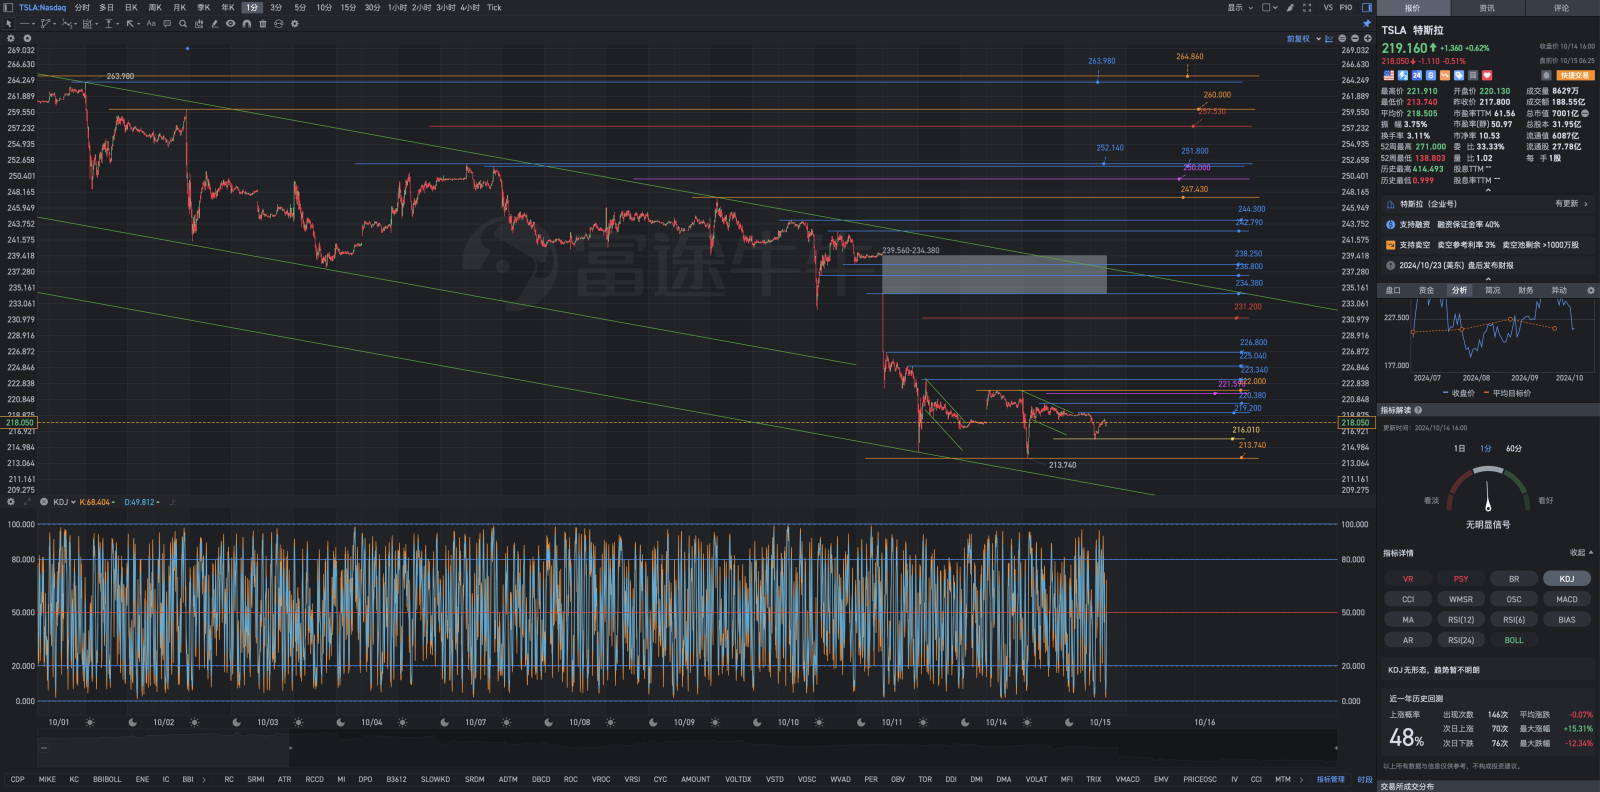
10月15日周二Tesla盘前复盘图表解析式
行情在绝望中爆发、犹豫中上涨、欢乐中死亡。你的注意点就是你的命运。跟着苍蝇找厕所,跟着蜜蜂找花朵,跟着千万挣百万,跟着乞丐会要饭。活鱼逆流而上,死鱼随波逐流。没有困难就没有智慧。人可以忍受不幸,也可以战胜不幸,因为人有着惊人的潜力,只要立志发挥它,就一定能渡过难关。顺境中的好运,为人们所希冀;逆境中的好运,则为人们所惊奇。最困难的时候,也就是离成功不远的时候。要想捉大鱼,不能怕水深。
焦虑不但是不会卸下明天的负担,反而是会去剥夺了你今天的快乐。经历酸甜苦辣才会更韵味悠长,或许生命中因为有了够多的云翳,才能造就一个美丽的黄昏。任何一次苦难的经历,只要不是毁灭,就是财富。上帝帮助信靠他的人。
学历是铜牌,能力是银牌,人脉是金牌,思维是王牌,耶稣是牌王,万王之王。成功的人不是赢在起点,而是赢在转折点。不要活在别人的嘴里,不要活在别人的眼里,而是把命运交到上帝手里,相信他依靠他。小聪明是战术,大智慧是战略;小聪明看到的是芝麻,大智慧看到的是西瓜。不说硬话,不干软事。
留有余地的弹性仓位管理是帐户稳定持续增长的基本保证,是职业投机者必备能力。
能改的,叫做缺点,不能改的,叫做弱点。当你穿过了暴风雨,你就不再是原来那个人。有一个夜晚我烧毁了所有的记忆,从此我的梦就透明了。当上帝赐给你荒野时,就意味着,他要你成为高飞的鹰。人们很少做他们相信是对的事,他们做比较方便的事,然后后悔。爱,是什么都介意,又什么都原谅。
本轮反弹的起始点是182.000,最高点是271.000。
顺大势,反技术,逆人性。
股价进入212.100–202.130区域启动护仓基金,有计划有步骤,分梯度分批次,离散型随机变量,建仓布局。
股价进入202.130–180.000区域启动深跌重买基金,有计划有步骤,分梯度分批次,离散型随机变量,建仓布局。
226.500以上就不要再建立新的多头仓位了。


论绝望:PSY是职业Trader必备之利器
什么是绝望?绝望在金融市场上也是有定量分析的。那就是:心理线(PSY)指标。
心理线(PSY)指标引是研究投资者对股市涨跌产生心理波动的情绪指标。它对股市短期走势的研判具有一定的参考意义。研究人员发现:一方面,人们的心理预期与市势的高低成正比,即市势升,心理预期也升,市势跌,心理预期也跌;另一方面,当人们的心理预期接近或达到极端的时候,逆反心理开始起作用,并可能最终导致心理预期方向的逆转。
1.一段下跌(上升)行情展开前,超买(超卖)的最高(低)点通常会出现两次。在出现第二次超买(超卖)的最高(低)点时,一般是卖出(买进)时机。由于PSY指标具有这种高点密集出现的特性,可给投资者带来充裕时间进行研判与介入。
2.PSY指标在25~75之间为常态分布。PSY指标主要反映市场心理的超买超卖,因此,当心理线指标在常态区域内上下移动时,一般应持观望态度。
3.PSY指标超过75或低于25时,表明股价开始步入超买区或超卖区,此时需要留心其动向。当PSY指标百分比值超过83或低于17时,表明市场出现超买区或超卖区,价位回跌或回升的机会增加,投资者应该准备卖出或买进,不必在意是否出现第二次信号。这种情况在个股中比较多见。
4.当PSY指标百分比值<10,是极度超卖。抢反弹的机会相对提高,此时为短期较佳的买进时机;反之,如果PSY指标百分比值>90,是极度超买。此时为短期卖出的有利时机。
5.当PSY曲线和PSYMA曲线同时向上运行时,为买入时机;相反,当PSY曲线与PSYMA曲线同时向下运行时,为卖出时机。而当PSY曲线向上突破PSYMA曲线时,为买入时机;相反,当PSY曲线向下跌破PSYMA曲线后,为卖出时机。
6.当PSY曲线向上突破PSYMA曲线后,开始向下回调至PSYMA曲线,只要PSY曲线未能跌破PSYMA曲线,都表明股价属于强势整理。一旦PSY曲线再度返身向上时,为买入时机;当PSY曲线和PSYMA曲线同时向上运行一段时间后,PSY曲线远离PSYMA曲线时,一旦PSY曲线掉头向下,说明股价上涨的动能消耗较大,为卖出时机。
7.当PSY曲线和PSYMA曲线再度同时向上延伸时,投资者应持股待涨;当PSY曲线在PSYMA曲线下方运行时,投资者应持币。
8.当PSY曲线和PSYMA曲线始终交织在一起,于一个波动幅度不大的空间内运动时,预示着股价处于盘整的格局中,投资者应以观望为主。
注意要点:
PSY指标与成交量变异率(VR)应配合使用,确定短期买卖点,可以找出每一波的高低点。另外,PSY指标最好与K线互相对照,如此更能从股价变动中了解超买或超卖的情况。
Tesla股票跌到这个阶段,我在此温馨提示阁下,好好学习和研究一下PSY(心理线指标)结合VR(成交量变异率)对自己的金融交易是非常有必要和及时的。
别不学无术:赢了去会所?输了搬砖头?那样赌博太没有出息了。赌博永远是高消费,有惊喜,但更多的是绝望。
On despair: PSY is a must-have tool for professional traders
What is despair? Despair is also quantitatively analyzed in financial markets. That is: the Psychological Line (PSY) indicator.
The Psychological Line (PSY) index is a sentiment indicator that studies the psychological fluctuations of investors on the rise and fall of the stock market. It has certain reference significance for the research and judgment of the short-term trend of the stock market. The researchers found that: on the one hand, people's psychological expectations are proportional to the level of the market trend, that is, when the market trend rises, psychological expectations also rise, and when the market trend falls, psychological expectations also fall; on the other hand, when people's psychological expectations approach or reach At extremes, contrarian psychology kicks in and can eventually lead to a reversal of the direction of psychological expectations.
1. Before a falling (rising) market begins, the overbought (oversold) highest (low) point usually occurs twice. When there is a second overbought (oversold) highest (low) point, it is generally the time to sell (buy). Since the PSY indicator has the characteristics of such high-point intensive appearance, it can give investors plenty of time for research, judgment and intervention.
2. The PSY index is normally distributed between 25 and 75. The PSY indicator mainly reflects the overbought and oversold market psychology. Therefore, when the psychological line indicator moves up and down in the normal area, you should generally take a wait-and-see attitude.
3. When the PSY indicator exceeds 75 or is lower than 25, it indicates that the stock price begins to enter the overbought or oversold area, and you need to pay attention to its movements at this time. When the percentage value of the PSY indicator exceeds 83 or is lower than 17, it indicates that the market is in an overbought area or an oversold area, and the chance of the price falling or rebounding increases. Investors should be prepared to sell or buy, without worrying about whether there is a second signal. . This situation is more common in individual stocks.
4. When the percentage value of the PSY indicator is <10, it is extremely oversold. The chances of catching a rebound are relatively high, and this is a better short-term buying opportunity; on the contrary, if the percentage value of the PSY indicator is>90, it is extremely overbought. This is a favorable time for short-term selling.
5. When the PSY curve and the PSYMA curve run upward at the same time, it is the time to buy; on the contrary, when the PSY curve and the PSYMA curve run downward at the same time, it is the time to sell. When the PSY curve breaks the PSYMA curve upwards, it is the time to buy; on the contrary, when the PSY curve falls below the PSYMA curve, it is the time to sell.
6. When the PSY curve breaks above the PSYMA curve, it begins to pull back down to the PSYMA curve. As long as the PSY curve fails to break below the PSYMA curve, it indicates that the stock price is in a strong consolidation. Once the PSY curve turns upward again, it is time to buy; when the PSY curve and the PSYMA curve run upwards for a period of time at the same time, and the PSY curve is far from the PSYMA curve, once the PSY curve turns downward, it means that the stock price rises consumes a lot of kinetic energy. Time to sell.
7. When the PSY curve and the PSYMA curve extend upward at the same time again, investors should hold the stock to rise; when the PSY curve runs below the PSYMA curve, investors should hold the currency.
8. When the PSY curve and the PSYMA curve are always intertwined and move in a space with little fluctuation, it indicates that the stock price is in a consolidation pattern, and investors should wait and see.
Points to note:
The PSY indicator and the volume variation rate (VR) should be used together to determine short-term buying and selling points, and the high and low points of each wave can be found. In addition, the PSY indicator is best to compare with the K-line, so that it can better understand the overbought or oversold situation from the stock price change.
Tesla stock has fallen to this stage. I would like to remind you that it is very necessary and timely to study and study the PSY (psychological line indicator) combined with VR (volume variation rate) for your financial transactions.
Don't be ignorant: If you win, go to the club? Lost moving bricks? Gambling like that is too useless. Gambling is always high spending, there are surprises, but more of it is despair.
免责声明:社区由Moomoo Technologies Inc.提供,仅用于教育目的。
更多信息
评论
登录发表评论
