Sample Name
Sample Code
Sample Name
Sample Code
Sample Name
Sample Code
4
IBM Corp
IBM
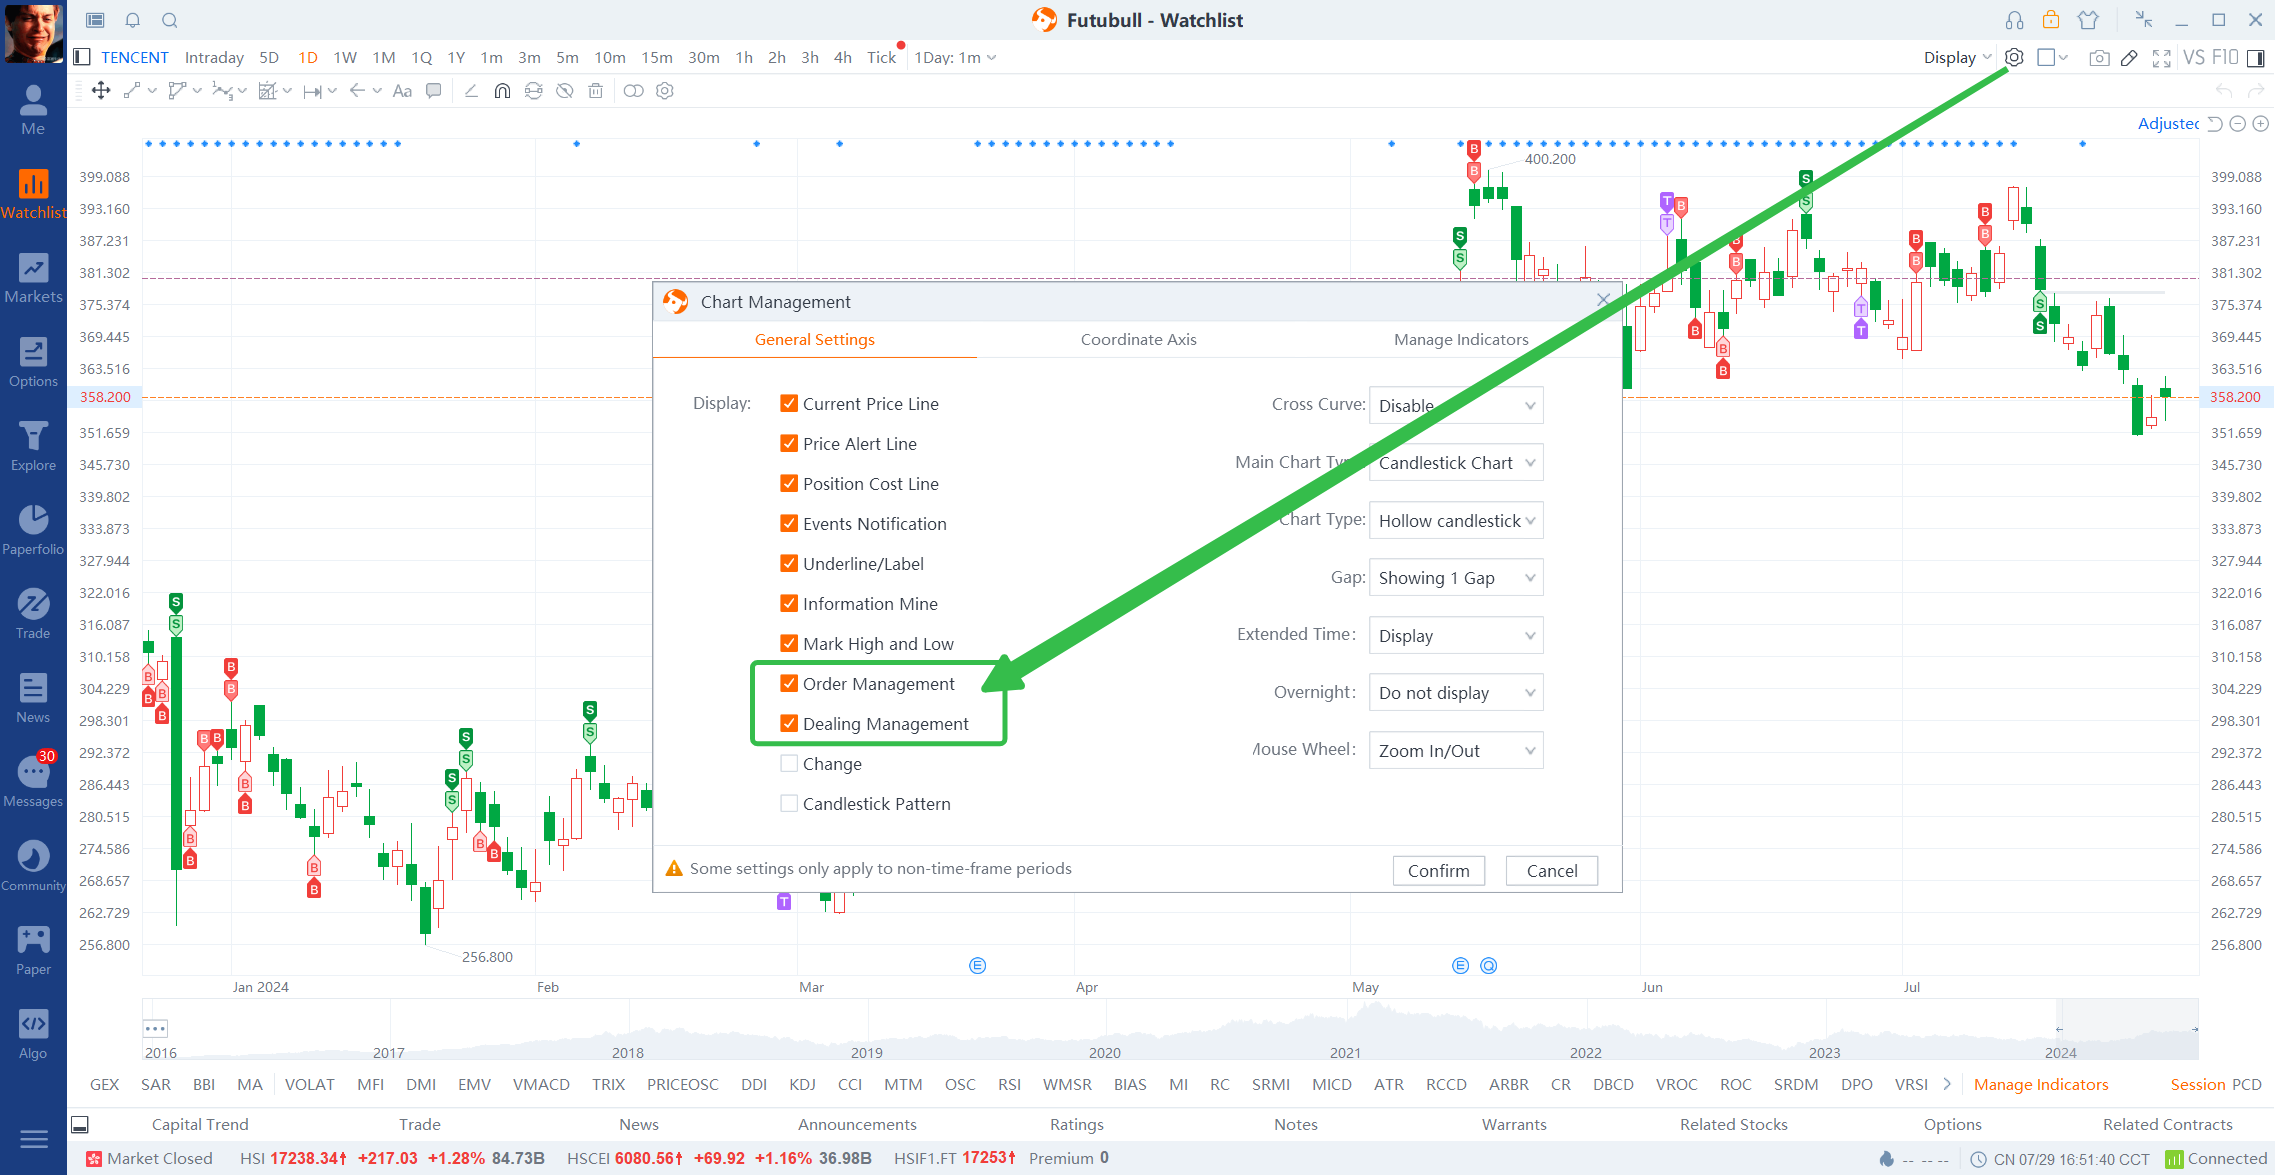
The Trade Marking feature enhances candlestick charts by visually marking your trades across historical data periods. This tool helps you better analyze past orders and trading activity.

1.2.1 The Trade Marking feature can help you add visual symbols for your trades and price levels.
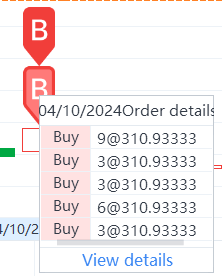
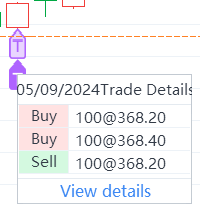
1) Trade Markings: Arrow icons indicate trades on the chart ('B' for buys, 'S' for sells, and 'T' for intraday trades), positioned above the corresponding candle without showing the exact fill price
2) Price Markings: Dot icons (red for buys, green for sells, purple for intraday trades) display the average fill price for transactions directly on the chart.
1.2.2 Markings will appear on the candlestick chart only after an order has been executed. If no order is filled, no markings will be shown.
1.2.3 Intraday historical charts will display only trade markings, not price markings.

1.2.4 Area and line charts do not support price markings.
Windows

Mac

2.2.1 Trade Marking is available for various candlestick chart intervals, including minute, hour, intraday, 5-day, daily, weekly, monthly, quarterly, and yearly.
2.2.2 Types of Markings


2.2.3 Notes

Risk Disclosure This presentation is for informational and educational use only and is not a recommendation or endorsement of any particular investment or investment strategy. Investment information provided in this content is general in nature, strictly for illustrative purposes, and may not be appropriate for all investors. It is provided without respect to individual investors’ financial sophistication, financial situation, investment objectives, investing time horizon, or risk tolerance. You should consider the appropriateness of this information having regard to your relevant personal circumstances before making any investment decisions. Past investment performance does not indicate or guarantee future success. Returns will vary, and all investments carry risks, including loss of principal. Moomoo makes no representation or warranty as to its adequacy, completeness, accuracy or timeliness for any particular purpose of the above content.