Self-driving cars include vehicles equipped with advanced sensors, cameras, and AI algorithms, that can navigate, make decisions, and drive without human intervention. Ranging from partial to full automation, these vehicles aim to revolutionize transportation by improving safety, reducing traffic congestion, and providing mobility solutions for those unable to drive. Self-driving cars have the potential to improve safety and efficiency as automated vehicles may significantly reduce road accidents caused by human error. The potential market of autonomous vehicles is projected to grow exponentially in the coming decades and disrupt the automotive and transportation industries.
- 3241.571
- -94.966-2.85%
- 5D
- Daily
- Weekly
- Monthly
- 1Q
- 1Y
News
Google Maps AI function upgraded significantly, is Apple Maps ready?
Map services have become a battleground for AI, with rivals such as Apple catching up, Google Maps continues to innovate and integrate more closely with AI. Users can now use natural language to search for nearby restaurants and other information on Google Maps, and get AI-summarized user reviews. They can also experience the weather and traffic conditions at the destination in advance, and even have a virtual campus tour in the future.
Cathie Wood Bets Big On Mark Zuckerberg: Ark Pours $19M Into Meta Shares, Dumps Palantir And Tesla Stock
Apple, Amazon, Intel, Peloton, And Tesla: Why These 5 Stocks Are On Investors' Radars Today
Intel has good news, with a big increase in stock price after hours! Q3 revenue and performance guidance exceeded expectations.
①intel's third-quarter financial report impressed analysts, and the stock price soared after hours; ②Chief Financial Officer David Zinsne stated that the company is 'making progress' in profitability, but there is 'still a lot of work to be done' to achieve the set goals.
Market Mover | Intel Shares Surge 6% After Q3 Earnings Release
Apple's quarterly revenue exceeded expectations, but sales in greater china remained stagnant.
①Apple's revenue in this quarter reached $94.93 billion, an increase of 6% year-on-year, with adjusted earnings per share of $1.64, both stronger than market expectations; ②Apple incurred a one-time tax expense of $10.2 billion earlier this year due to a ruling by the European Union, resulting in a nearly 36% year-on-year decline in net income for the quarter.
Comments
For META, the current level is in the buying zone for both near & long-term. If VIX down, could up 2% or above.
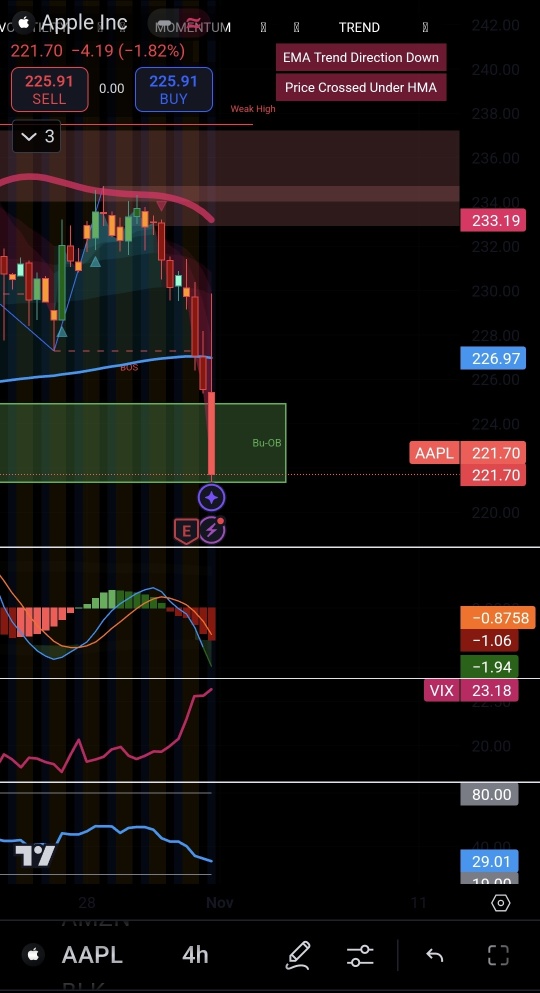
For AAPL, it is quite difficult to say up or down because it is usually not voltile. But, due to recent earning reports, the stock might still be under massive s...


So, will the market crash?
Global markets and indicators are suggesting a big pullback could be coming. This generally happens ahead of a US election. U...
In this previous article, I mentioned that the stock:
attempted to reach its all-time high but closed with a doji formation. This doji suggests profit-taking at the highs...


