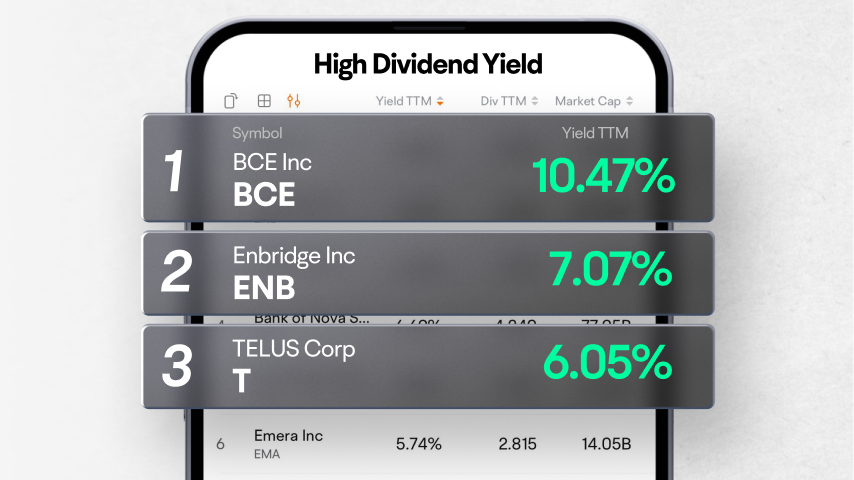
Enbridge Inc
ENB
Choice Properties Real Estate Investment Trust
CHP.UN
Brookfield Renewable Partners LP
BEP.UN
The Toronto-Dominion Bank
TD
TC Energy Corp
TRP
| (FY)Aug 31, 2024 | (Q4)Aug 31, 2024 | (Q3)May 31, 2024 | (Q2)Feb 29, 2024 | (Q1)Nov 30, 2023 | (FY)Aug 31, 2023 | (Q4)Aug 31, 2023 | (Q3)May 31, 2023 | (Q2)Feb 28, 2023 | (Q1)Nov 30, 2022 | |
|---|---|---|---|---|---|---|---|---|---|---|
| Total revenue | 0 | 0 | 0 | 0 | 0 | 0 | 0 | 0 | 0 | 0 |
| Operating revenue | --0 | --0 | --0 | --0 | --0 | --0 | --0 | --0 | --0 | --0 |
| Cost of revenue | -13.25%72K | -8.79%83K | ||||||||
| Gross profit | 13.25%-72K | 8.79%-83K | ||||||||
| Operating expense | -18.65%4.71M | -58.57%532K | 29.39%1.77M | -24.27%861K | -22.67%1.55M | -9.70%5.79M | -10.02%1.28M | 8.31%1.37M | -34.66%1.14M | 0.96%2M |
| Selling and administrative expenses | -18.65%4.71M | -58.57%532K | 29.39%1.77M | -24.27%861K | -22.67%1.55M | -9.70%5.79M | -10.02%1.28M | 8.31%1.37M | -34.66%1.14M | 0.96%2M |
| -General and administrative expense | -18.65%4.71M | -58.57%532K | 29.39%1.77M | -24.27%861K | -22.67%1.55M | -9.70%5.79M | -10.02%1.28M | 8.31%1.37M | -34.66%1.14M | 0.96%2M |
| Operating profit | 18.57%-4.78M | 55.82%-604K | -29.39%-1.77M | 24.27%-861K | 22.67%-1.55M | 9.68%-5.88M | 9.95%-1.37M | -8.31%-1.37M | 34.66%-1.14M | -0.96%-2M |
| Net non-operating interest income (expenses) | -25.34%436K | -30.25%83K | -25.69%107K | -39.34%111K | -2.17%135K | 139.62%584K | 40.00%119K | 260.00%144K | 132.80%183K | 113.26%138K |
| Non-operating interest income | -25.34%436K | -30.25%83K | -25.69%107K | -39.34%111K | -2.17%135K | 231.82%584K | 40.00%119K | 260.00%144K | 603.85%183K | 452.00%138K |
| Other net income (expenses) | 30.91%-228K | 88.27%-38K | 241.67%17K | 74.29%-63K | -157.37%-144K | -21.77%-330K | -173.14%-324K | 86.21%-12K | 27.08%-245K | 186.25%251K |
| Gain on sale of security | -98.37%4K | 11.36%-39K | 241.67%17K | -122.00%-11K | -85.26%37K | -27.94%245K | -109.93%-44K | 78.57%-12K | -48.45%50K | 274.31%251K |
| Special income (charges) | ---- | ---- | ---- | ---- | ---- | --0 | ---- | ---- | ---- | ---- |
| -Less:Restructuring and mergern&acquisition | ---- | ---- | ---- | ---- | ---- | --0 | ---- | ---- | ---- | ---- |
| Income before tax | 18.59%-4.58M | 64.44%-559K | -33.17%-1.65M | 32.19%-813K | 3.47%-1.56M | 31.87%-5.62M | -58.79%-1.57M | 5.65%-1.24M | 54.48%-1.2M | 51.33%-1.61M |
| Income tax | -26.19%31K | 700.00%42K | ||||||||
| Earnings from equity interest net of tax | ||||||||||
| Net income | 18.65%-4.61M | 63.44%-590K | -33.17%-1.65M | 32.19%-813K | 3.47%-1.56M | 31.30%-5.66M | -64.19%-1.61M | 5.65%-1.24M | 54.48%-1.2M | 51.33%-1.61M |
| Net income continuous operations | 18.65%-4.61M | 63.44%-590K | -33.17%-1.65M | 32.19%-813K | 3.47%-1.56M | 31.30%-5.66M | -64.19%-1.61M | 5.65%-1.24M | 54.48%-1.2M | 51.33%-1.61M |
| Noncontrolling interests | ||||||||||
| Net income attributable to the company | 18.65%-4.61M | 63.44%-590K | -33.17%-1.65M | 32.19%-813K | 3.47%-1.56M | 31.30%-5.66M | -64.19%-1.61M | 5.65%-1.24M | 54.48%-1.2M | 51.33%-1.61M |
| Preferred stock dividends | ||||||||||
| Other under preferred stock dividend | ||||||||||
| Net income attributable to common stockholders | 18.65%-4.61M | 63.44%-590K | -33.17%-1.65M | 32.19%-813K | 3.47%-1.56M | 31.30%-5.66M | -64.19%-1.61M | 5.65%-1.24M | 54.48%-1.2M | 51.33%-1.61M |
| Diluted earnings per share | 16.67%-0.05 | 50.00%-0.01 | -100.00%-0.02 | 0.00%-0.01 | 0.00%-0.02 | 33.33%-0.06 | -100.00%-0.02 | 0.00%-0.01 | 66.67%-0.01 | 50.00%-0.02 |
| Basic earnings per share | 16.67%-0.05 | 50.00%-0.01 | -100.00%-0.02 | 0.00%-0.01 | 0.00%-0.02 | 33.33%-0.06 | -100.00%-0.02 | 0.00%-0.01 | 66.67%-0.01 | 50.00%-0.02 |
| Dividend per share | ||||||||||
| Accounting Standards | US-GAAP | US-GAAP | US-GAAP | US-GAAP | US-GAAP | US-GAAP | US-GAAP | US-GAAP | US-GAAP | US-GAAP |
| Audit Opinions | Unqualified Opinion | -- | -- | -- | -- | Unqualified Opinion | -- | -- | -- | -- |
FY: Financial Year. Refers to the 10-K file disclosed by the listed company to the SEC.
Q: Quarter. Refers to the 10-Q file disclosed by the listed company to the SEC. Q1, Q2, Q3, and Q4 are quarterly reports each with a span of 3 months; Q6 and Q9 are cumulative reports, with Q6 including 6 months and Q9 9 months.
