Analysis of the Tesla pre-market rehearsal chart for Thursday July 18th
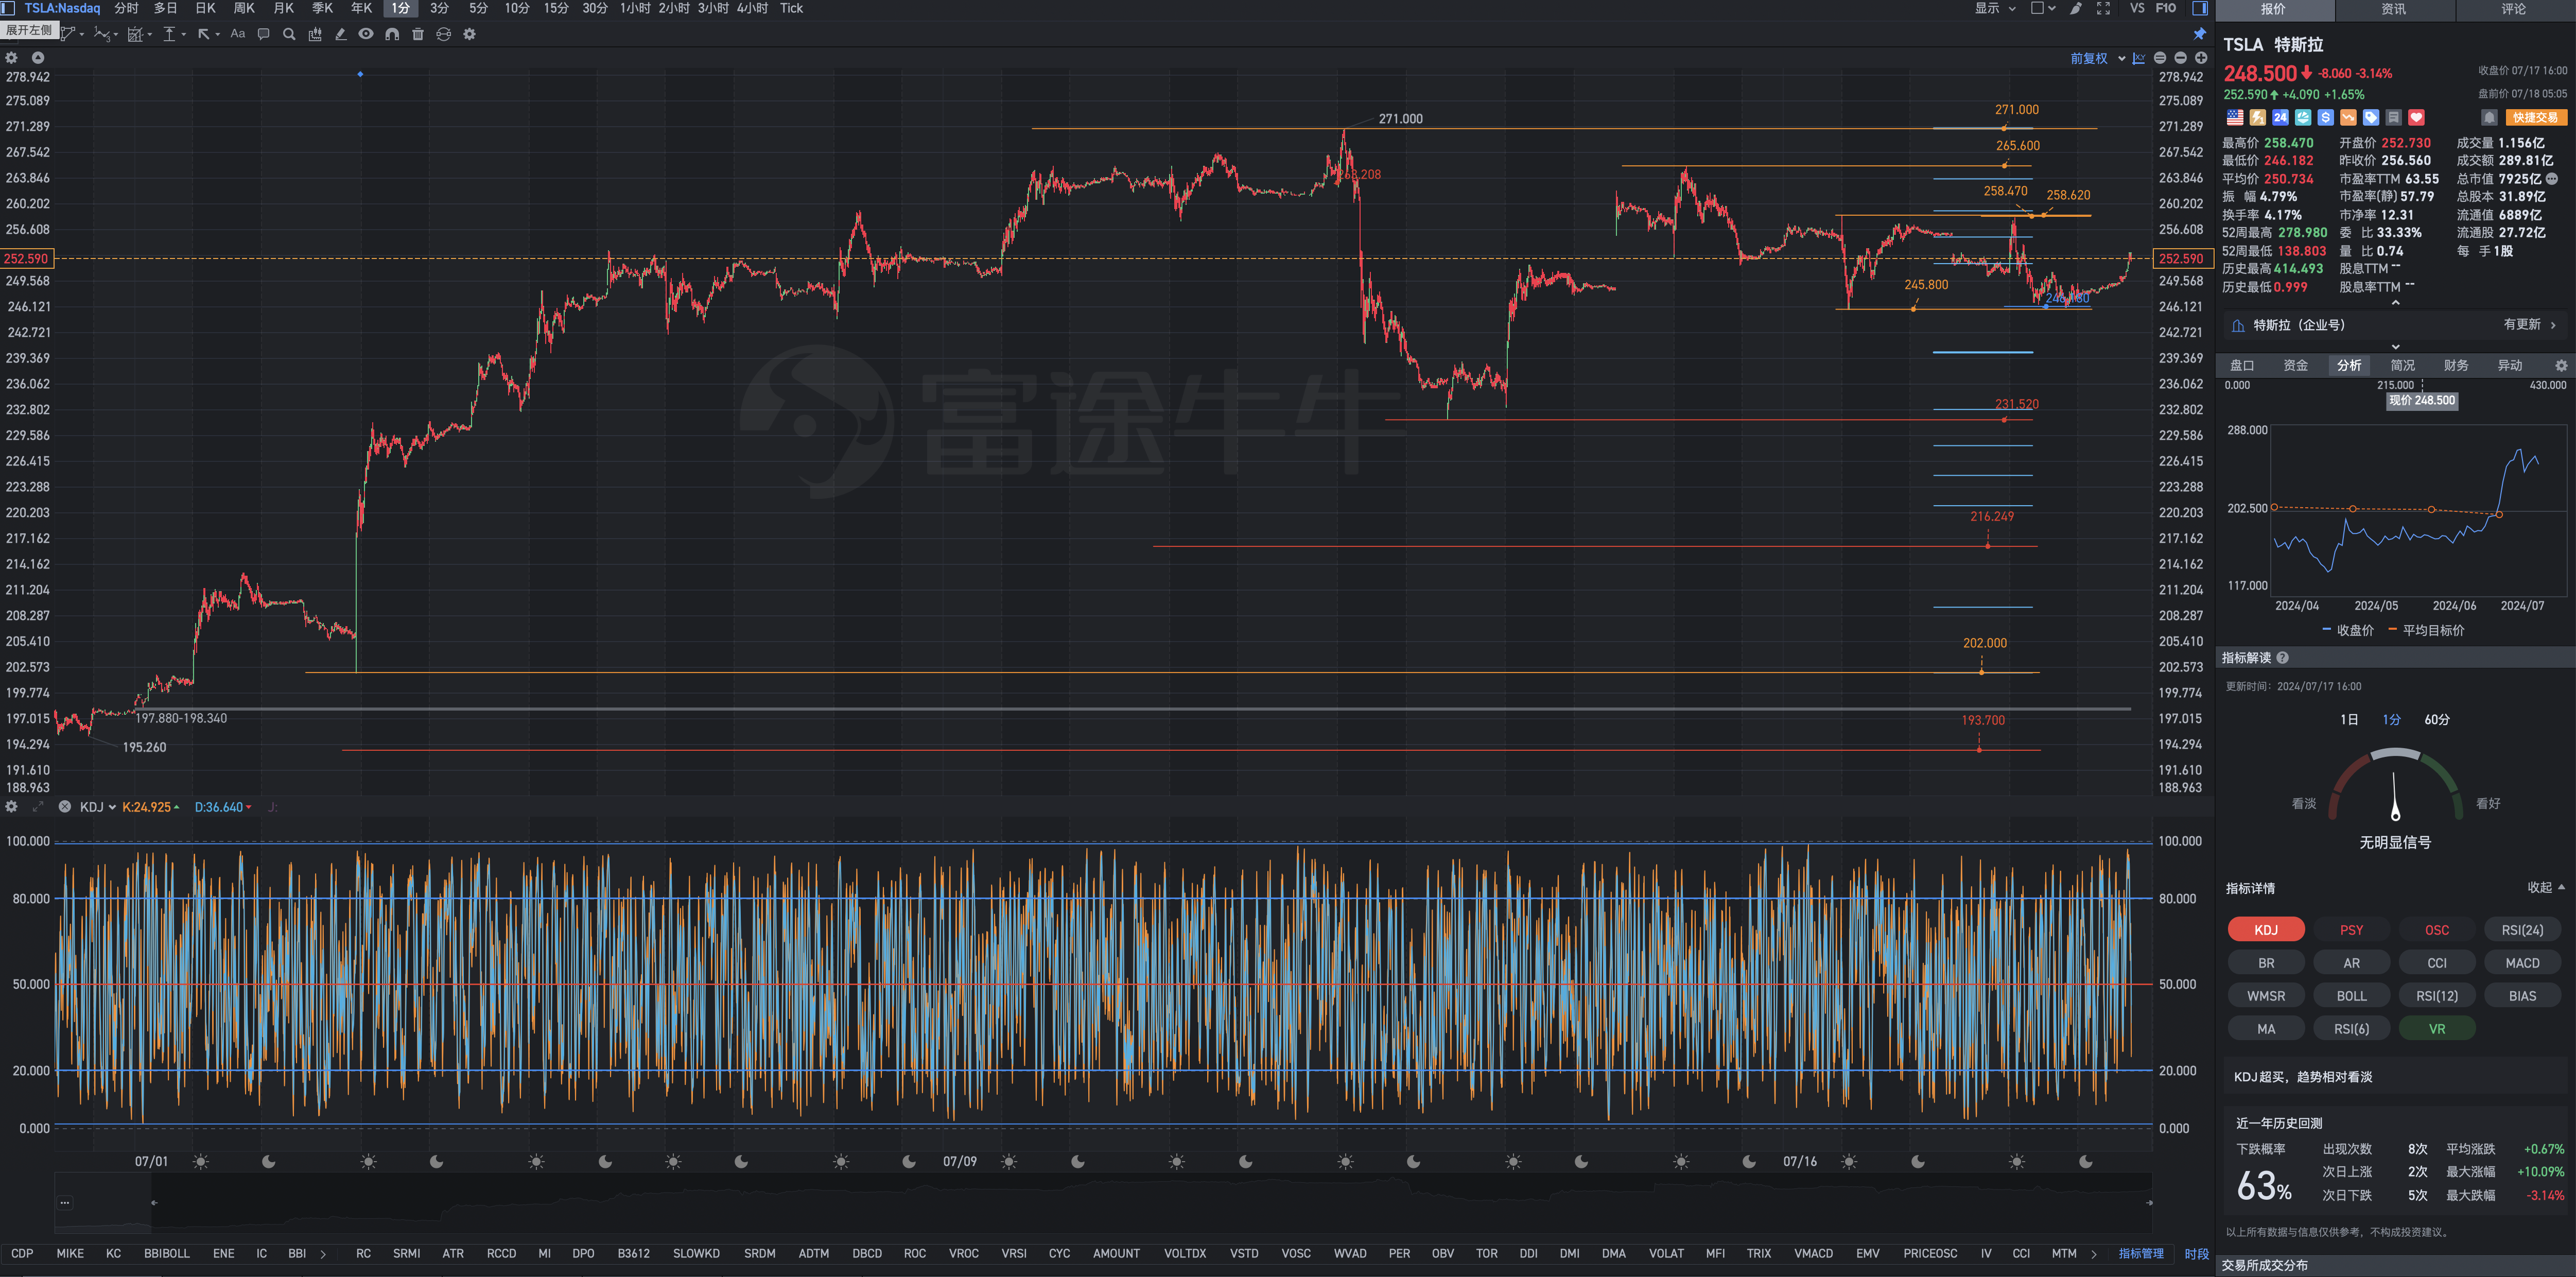
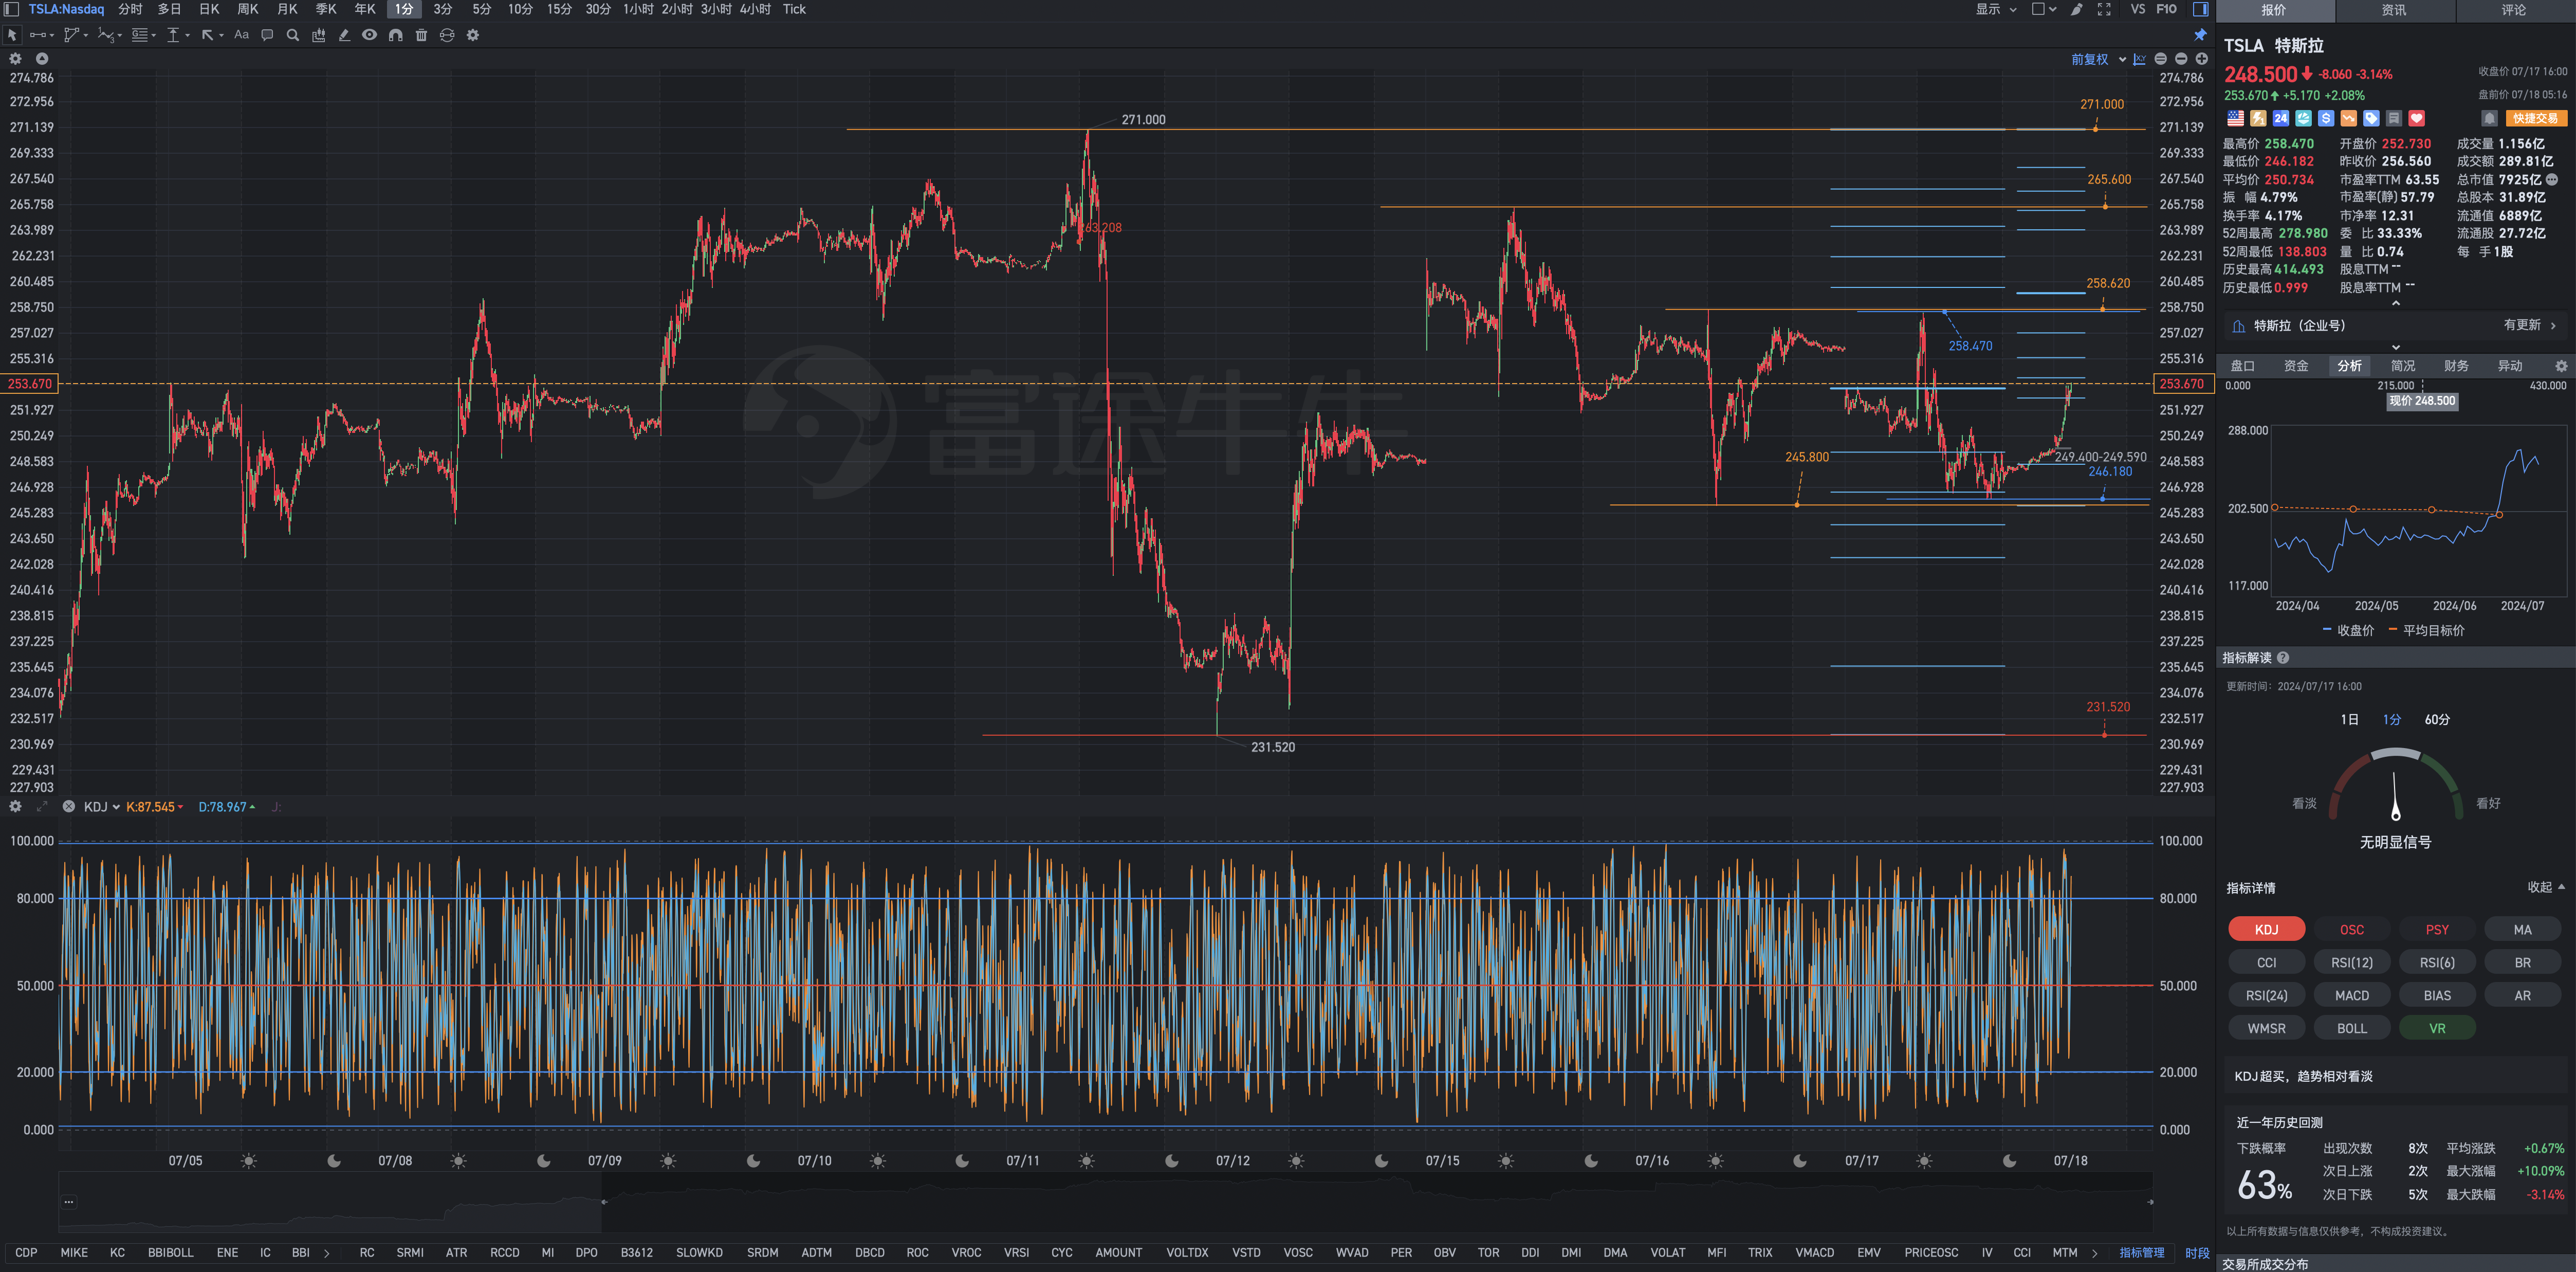
1. The fear of the Lord is the beginning of wisdom. Awe of technical barriers to quantitative prediction (the principle of unpredictability and the principle of spatial orientation disorder) is to acknowledge the value of technology and understand the limitations of technology. You still have to rely on yourself to correctly and profoundly interpret the function curves of technical indicators. The results obtained from modeling and quantitative analysis: The starting technical level for this round of upward market growth was 202.000, and the final stage of this round of adjusted decline was 240.530-231.520. Calculated from the highest peak of 271.000 that has been achieved so far, the decline is already huge. However, the profit chip ratio is still above 70%, which indicates that the trend is actually quite strong. Flexibility is the best ability. The 246.180 area where the stock price is above 245.800 lost its downward momentum MV and impulse FT. Positions were opened twice at around 14:30 and 15:00 EST on Wednesday afternoon. There was basically a tie. It wasn't until Thursday that there was a slight fluctuation. Because the stock price did not reach the 240.530-231.520 anti-aircraft fire ambush zone, it was just a fire of a reconnaissance nature. Hoping for an opportunity to increase your holdings again on Thursday EST? Let fate take its course. They are also people who have lost their share career, so why brag when you meet them?
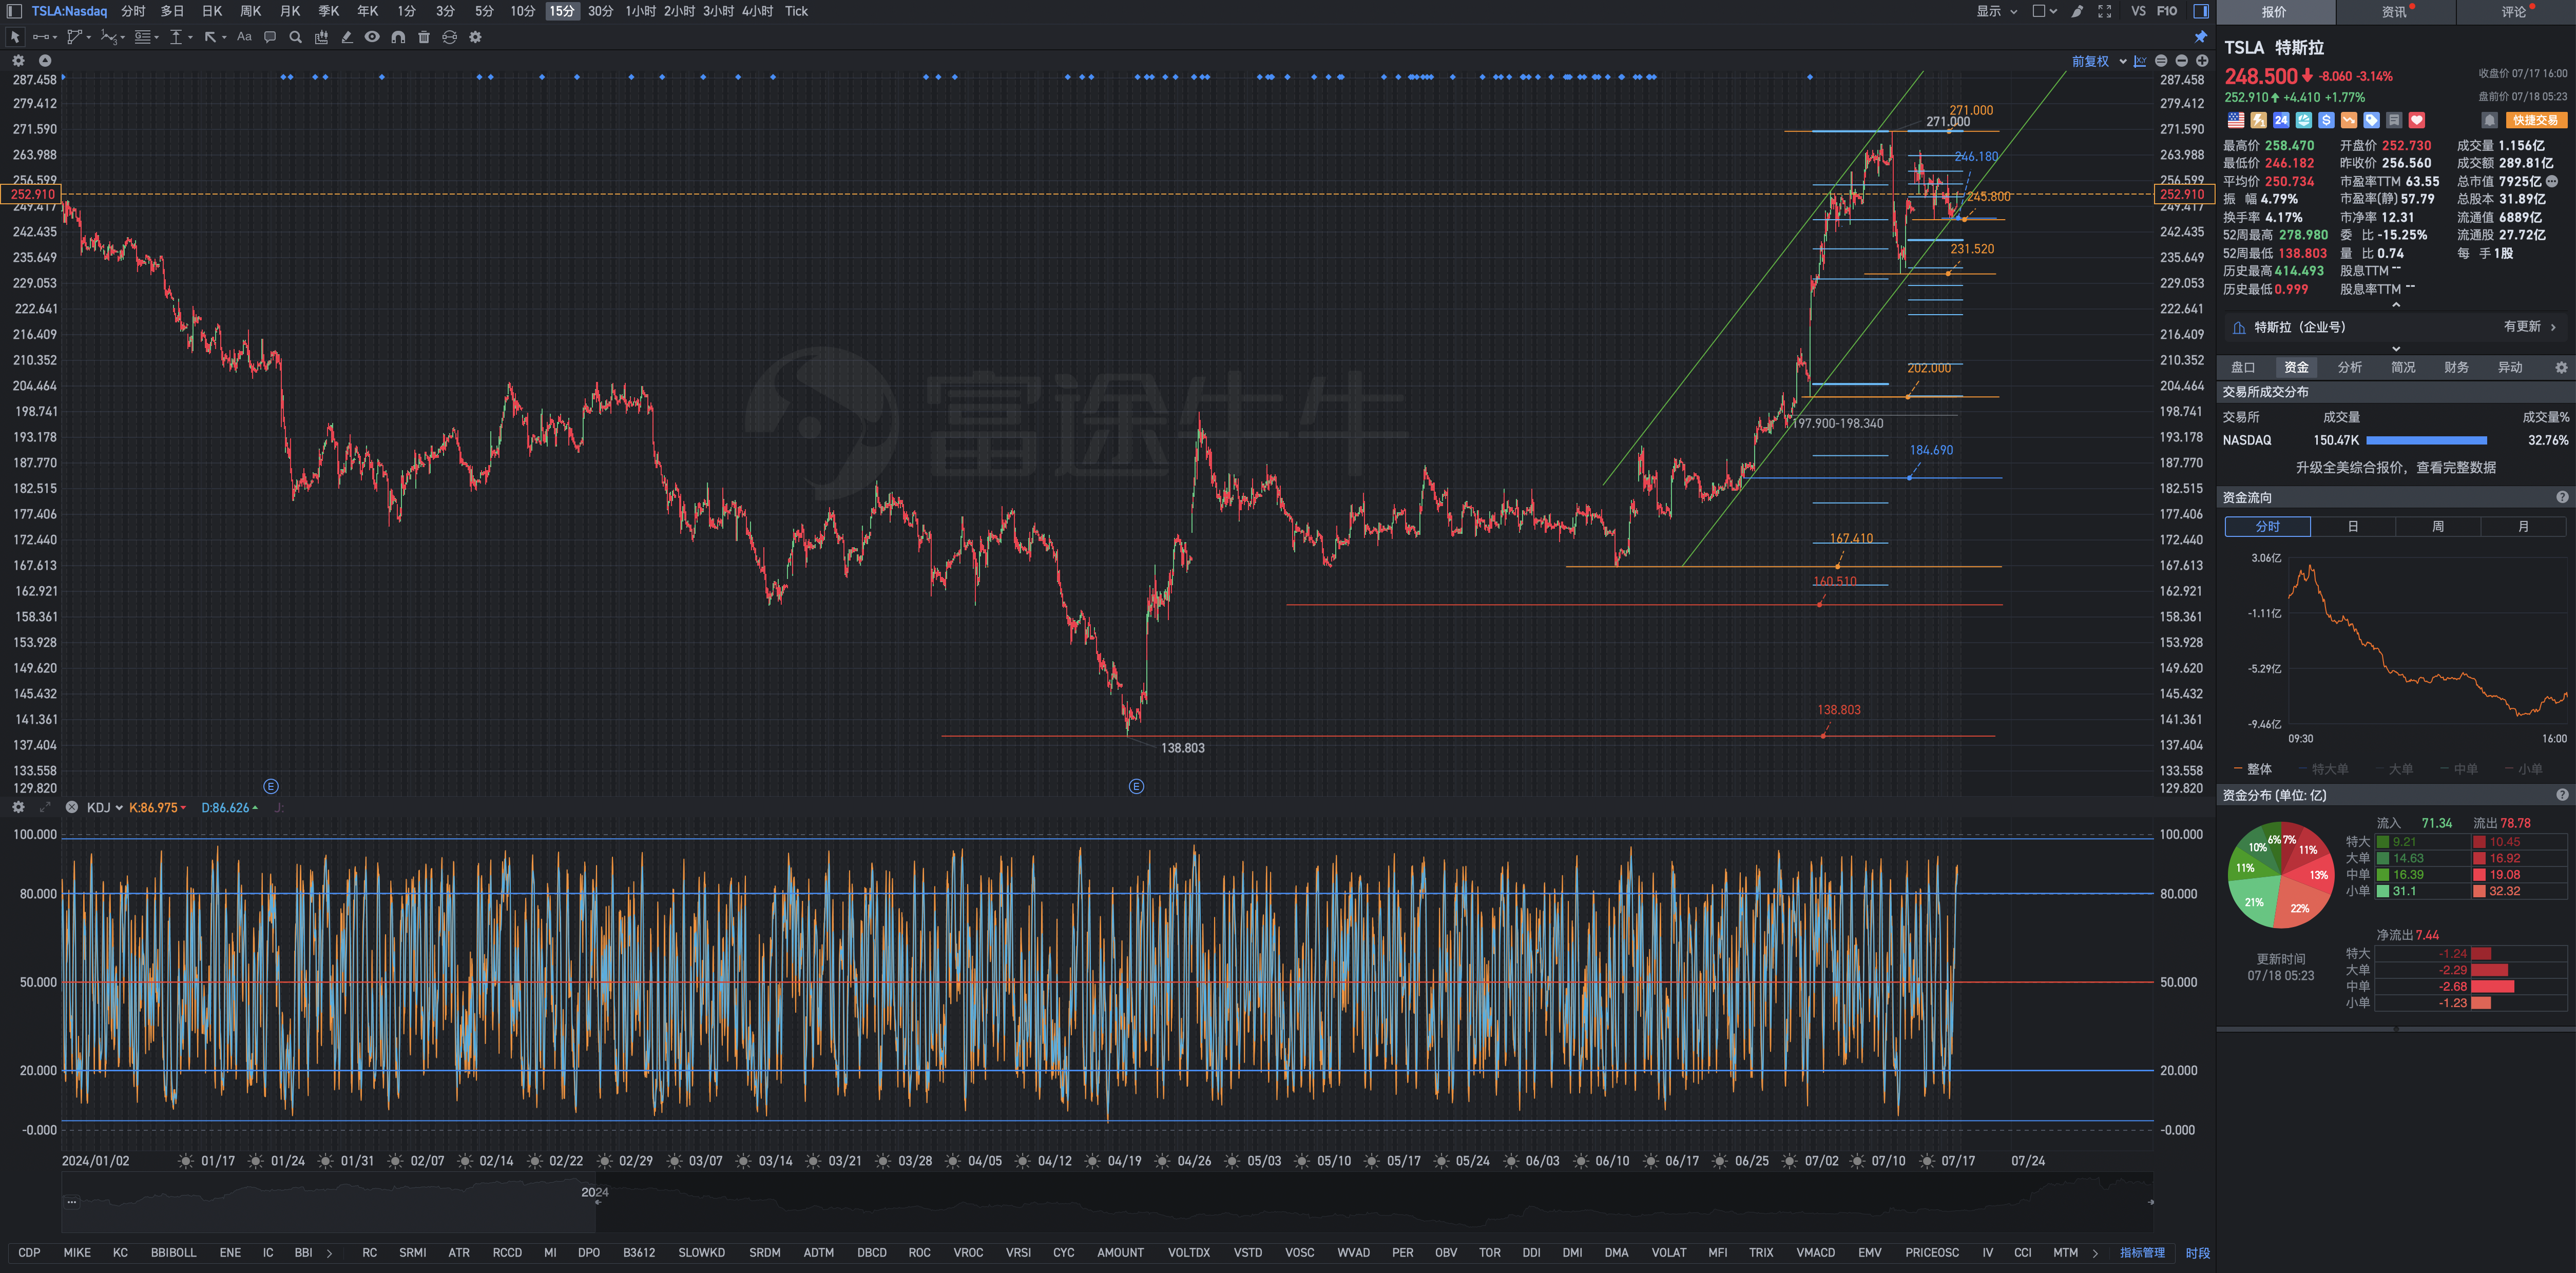
2. Although the elevation angle of the 1-minute ascending channel is constantly being reduced, or even completely destroyed, you don't see any immediate complaints on the market and the sound of Tesla's decay flock in, but judging from the 15-minute chart and the 1-hour chart, although the elevation angles of the 15-minute ascent channel and the 1-hour ascent channel have also been reduced, they still exist effectively. So, the gains are still valid.
3. Within the range that can be found in the short term, the stock price will then hit the strong resistance zone above 271 again at 299.290-314.800. Going all the way from 138.800-160.510, are you still afraid that it won't be able to pierce 299.290-314.800? The time function is under your control, so why be afraid?


Disclaimer: Community is offered by Moomoo Technologies Inc. and is for educational purposes only.
Read more
Comment
Sign in to post a comment
