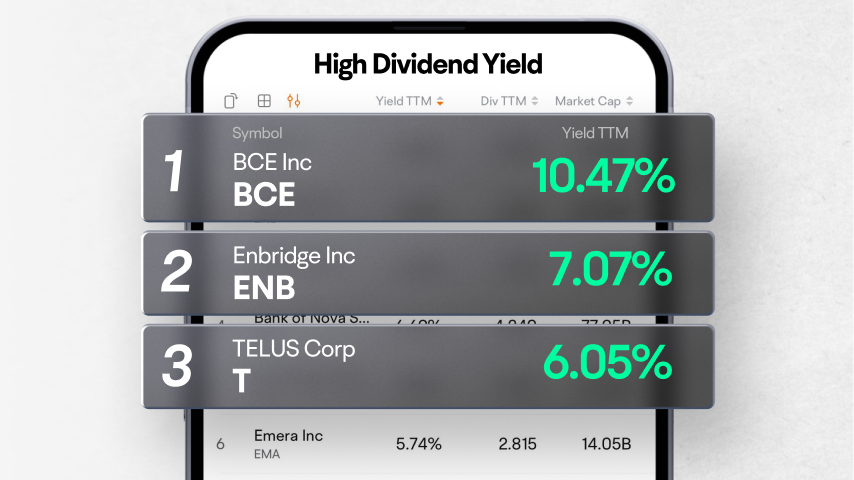
Enbridge Inc
ENB
TC Energy Corp
TRP
Bank of Nova Scotia
BNS
Brookfield Renewable Partners LP
BEP.UN
Emera Inc
EMA
| (Q3)Sep 30, 2024 | (Q2)Jun 30, 2024 | (Q1)Mar 31, 2024 | (FY)Dec 31, 2023 | (Q4)Dec 31, 2023 | (Q3)Sep 30, 2023 | (Q2)Jun 30, 2023 | (Q1)Mar 31, 2023 | (FY)Dec 31, 2022 | (Q4)Dec 31, 2022 | |
|---|---|---|---|---|---|---|---|---|---|---|
| Assets | ||||||||||
| Current assets | ||||||||||
| Cash, cash equivalents and short term investments | -84.13%27.68K | -19.28%3.92K | -75.52%55.62K | -26.84%140.2K | -26.84%140.2K | -78.03%174.48K | -99.79%4.86K | -91.34%227.16K | -93.18%191.63K | -93.18%191.63K |
| -Cash and cash equivalents | -84.13%27.68K | -19.28%3.92K | -75.52%55.62K | -26.84%140.2K | -26.84%140.2K | -78.03%174.48K | -99.79%4.86K | -91.34%227.16K | -93.18%191.63K | -93.18%191.63K |
| Receivables | 104.82%23.94K | -64.00%7.44K | 312.11%29.91K | -67.54%51.25K | -67.54%51.25K | -94.62%11.69K | -75.36%20.66K | -83.83%7.26K | 410.56%157.89K | 410.56%157.89K |
| -Taxes receivable | 104.82%23.94K | -64.00%7.44K | -32.38%4.91K | -91.82%11.25K | -91.82%11.25K | -94.07%11.69K | -75.36%20.66K | -83.83%7.26K | 344.46%137.45K | 344.46%137.45K |
| -Due from related parties current | ---- | ---- | ---- | ---- | ---- | --0 | ---- | ---- | ---- | ---- |
| -Other receivables | ---- | ---- | --25K | 95.69%40K | 95.69%40K | ---- | ---- | ---- | --20.44K | --20.44K |
| Prepaid assets | -13.48%13.66K | -43.84%962 | -62.73%5.54K | -11.47%10.12K | -11.47%10.12K | -86.06%15.79K | -16.15%1.71K | 561.52%14.87K | 133.59%11.43K | 133.59%11.43K |
| Restricted cash | --1 | --1 | ---- | ---- | ---- | ---- | ---- | ---- | ---- | ---- |
| Other current assets | ---- | ---- | ---- | ---- | ---- | ---- | --1 | ---- | ---- | ---- |
| Total current assets | -67.68%65.28K | -54.76%12.32K | -63.47%91.06K | -44.16%201.57K | -44.16%201.57K | -82.05%201.96K | -98.84%27.23K | -90.67%249.29K | -87.32%360.95K | -87.32%360.95K |
| Non current assets | ||||||||||
| Net PPE | 13.78%771.13K | 16.35%771.13K | 16.35%771.13K | 16.35%771.13K | 16.35%771.13K | 7.09%677.77K | 18.38%662.77K | 18.38%662.77K | 18.61%662.77K | 18.61%662.77K |
| Total non current assets | 13.78%771.13K | 16.35%771.13K | 16.35%771.13K | 16.35%771.13K | 16.35%771.13K | 7.09%677.77K | 18.38%662.77K | 18.38%662.77K | 18.61%662.77K | 18.61%662.77K |
| Total assets | -4.92%836.41K | 13.54%783.45K | -5.47%862.2K | -4.98%972.7K | -4.98%972.7K | -49.95%879.72K | -76.35%690K | -71.77%912.05K | -69.94%1.02M | -69.94%1.02M |
| Liabilities | ||||||||||
| Current liabilities | ||||||||||
| Payables | -60.93%287.62K | --383.85K | -29.51%384.44K | 13.28%469.63K | 13.28%469.63K | 131.07%736.21K | ---- | 403.84%545.4K | 735.92%414.59K | 735.92%414.59K |
| -accounts payable | -60.93%287.62K | --383.85K | -29.51%384.44K | 13.28%469.63K | 13.28%469.63K | 131.07%736.21K | ---- | 403.84%545.4K | 735.92%414.59K | 735.92%414.59K |
| Current accrued expenses | -64.02%23.85K | --7.95K | -80.13%7.95K | -38.49%32.6K | -38.49%32.6K | 25.09%66.3K | ---- | -20.00%40K | 32.50%53K | 32.50%53K |
| Other current liabilities | 839.82%164.47K | --44.61K | --44.61K | 113.40%45.67K | 113.40%45.67K | --17.5K | ---- | ---- | --21.4K | --21.4K |
| Current liabilities | -41.96%475.94K | -30.85%436.41K | -25.35%436.99K | 12.05%547.9K | 12.05%547.9K | 120.66%820K | 122.94%631.06K | 269.92%585.4K | 445.77%488.99K | 445.77%488.99K |
| Non current liabilities | ||||||||||
| Total non current liabilities | --0 | --0 | --0 | --0 | --0 | --1 | --1 | --0 | --0 | --0 |
| Total liabilities | -41.96%475.94K | -30.85%436.41K | -25.35%436.99K | 12.05%547.9K | 12.05%547.9K | 120.66%820K | 122.95%631.06K | 269.92%585.4K | 445.77%488.99K | 445.77%488.99K |
| Shareholders'equity | ||||||||||
| Share capital | 6.77%4.63M | 6.94%4.54M | 6.00%4.5M | 1.53%4.31M | 1.53%4.31M | 5.18%4.34M | 8.83%4.25M | 8.83%4.25M | 8.83%4.25M | 8.83%4.25M |
| -common stock | 6.77%4.63M | 6.94%4.54M | 6.00%4.5M | 1.53%4.31M | 1.53%4.31M | 5.18%4.34M | 8.83%4.25M | 8.83%4.25M | 8.83%4.25M | 8.83%4.25M |
| Retained earnings | -2.65%-4.64M | -3.35%-4.51M | -7.36%-4.43M | -11.04%-4.36M | -11.04%-4.36M | -56.70%-4.52M | -208.47%-4.37M | -322.69%-4.13M | -435.10%-3.92M | -435.10%-3.92M |
| Other equity interest | 51.80%371.95K | 77.94%319.51K | 69.82%359.51K | 121.99%469.95K | 121.99%469.95K | 64.87%245.02K | 20.82%179.56K | 42.45%211.7K | 42.45%211.7K | 42.45%211.7K |
| Total stockholders'equity | 503.61%360.47K | 488.85%347.04K | 30.17%425.2K | -20.56%424.81K | -20.56%424.81K | -95.69%59.72K | -97.76%58.94K | -89.37%326.66K | -83.88%534.73K | -83.88%534.73K |
| Total equity | 503.61%360.47K | 488.85%347.04K | 30.17%425.2K | -20.56%424.81K | -20.56%424.81K | -95.69%59.72K | -97.76%58.94K | -89.37%326.66K | -83.88%534.73K | -83.88%534.73K |
| Accounting Standards | US-GAAP | US-GAAP | US-GAAP | US-GAAP | US-GAAP | US-GAAP | US-GAAP | US-GAAP | US-GAAP | US-GAAP |
| Audit Opinions | -- | -- | -- | Unqualified Opinion with Explanatory Notes | -- | -- | -- | -- | -- | -- |
FY: Financial Year. Refers to the 10-K file disclosed by the listed company to the SEC.
Q: Quarter. Refers to the 10-Q file disclosed by the listed company to the SEC. Q1, Q2, Q3, and Q4 are quarterly reports each with a span of 3 months; Q6 and Q9 are cumulative reports, with Q6 including 6 months and Q9 9 months.
