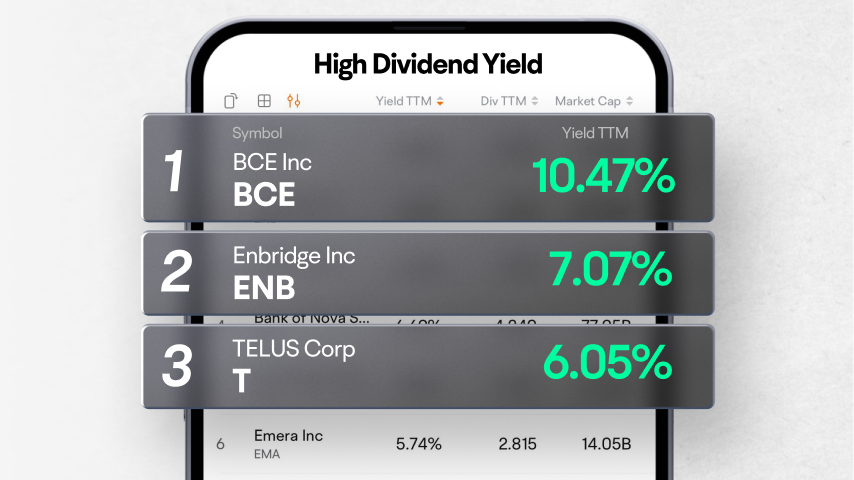
Enbridge Inc
ENB
Choice Properties Real Estate Investment Trust
CHP.UN
Brookfield Renewable Partners LP
BEP.UN
The Toronto-Dominion Bank
TD
TC Energy Corp
TRP
| (Q3)Sep 30, 2022 | (Q2)Jun 30, 2022 | (Q1)Mar 31, 2022 | (FY)Dec 31, 2021 | (Q4)Dec 31, 2021 | (Q3)Sep 30, 2021 | (Q2)Jun 30, 2021 | (Q1)Mar 31, 2021 | (FY)Dec 31, 2020 | (Q4)Dec 31, 2020 | |
|---|---|---|---|---|---|---|---|---|---|---|
| Total revenue | -23.21%82.28M | -6.32%93.42M | -11.43%86.25M | 60.50%405.72M | 46.58%101.45M | 62.77%107.16M | 76.37%99.72M | 59.15%97.38M | 34.55%252.78M | 42.12%69.22M |
| Cost of revenue | 48.70%93.49M | 65.41%86.81M | 9.35%62.13M | 8.29%224.35M | 1.27%52.18M | 25.78%62.87M | 5.04%52.48M | 2.01%56.82M | 49.74%207.17M | 34.82%51.53M |
| Gross profit | -125.30%-11.21M | -86.00%6.61M | -40.54%24.12M | 297.59%181.37M | 178.53%49.27M | 179.40%44.29M | 617.67%47.24M | 638.47%40.56M | -7.88%45.62M | 68.71%17.69M |
| Operating expense | -35.97%2.1M | -53.27%1.01M | 138.64%4.93M | 47.42%14.53M | 71.16%7.01M | 62.83%3.29M | 152.91%2.17M | -28.42%2.07M | -12.76%9.86M | 47.04%4.1M |
| Staff costs | 7.80%318K | 15.48%179K | 15.58%178K | 10.17%899K | 19.43%295K | 18.95%295K | -3.13%155K | -4.35%154K | 31.83%816K | -3.52%247K |
| Selling and administrative expenses | -60.43%905K | -40.22%868K | 127.78%3.58M | 41.74%9.72M | 32.02%4.4M | 68.04%2.29M | 222.67%1.45M | -7.90%1.57M | 2.02%6.85M | 163.43%3.34M |
| -General and administrative expense | -60.43%905K | -40.22%868K | 127.78%3.58M | 41.74%9.72M | 32.02%4.4M | 68.04%2.29M | 222.67%1.45M | -7.90%1.57M | 2.02%6.85M | 163.43%3.34M |
| Other operating expenses | 25.14%881K | -105.86%-33K | 245.27%1.17M | 79.14%3.92M | 350.49%2.31M | 72.13%704K | 127.02%563K | -66.73%338K | -44.81%2.19M | -59.38%513K |
| Operating profit | -132.46%-13.31M | -87.58%5.6M | -50.15%19.19M | 366.54%166.84M | 210.88%42.26M | 196.40%41M | 687.32%45.07M | 1,376.19%38.5M | -6.43%35.76M | 76.55%13.59M |
| Net non-operating interest income (expenses) | -11.60%-510K | -153.44%-626K | -279.52%-315K | -9,344.44%-13.6M | -16,540.26%-12.81M | -657.32%-457K | -78.99%-247K | -654.55%-83K | -289.19%-144K | -450.00%-77K |
| Non-operating interest income | -93.33%1K | 128.57%16K | --1K | -71.07%57K | -54.32%37K | -89.44%15K | 250.00%7K | --0 | 278.85%197K | 272.34%81K |
| Non-operating interest expense | 8.26%511K | 152.76%642K | 280.72%316K | 463.05%1.92M | 405.91%1.11M | 686.67%472K | 81.43%254K | 538.46%83K | 283.15%341K | 766.67%220K |
| Total other finance cost | ---- | ---- | ---- | --11.74M | ---- | ---- | ---- | ---- | ---- | ---- |
| Net investment income | 91.86%5.63M | 935.67%7.52M | -12.18%2.57M | 272.22%6.59M | 190.16%1.62M | 308.08%2.94M | 15.17%-900K | 558.43%2.93M | -1,193.14%-3.83M | -34.05%-1.8M |
| Gain(Loss) on financial instruments designated as cash flow hedges | ||||||||||
| Gain(Loss) on derecognition of available-for-sale financial assets | ||||||||||
| Income from associates and other participating interests | ||||||||||
| Special income (charges) | 97.02%-49K | 99.76%-4K | ||||||||
| Less:Write off | ---- | ---- | ---- | ---- | ---- | ---- | ---- | ---- | -97.11%49K | -99.76%4K |
| Other non-operating income (expenses) | 130.77%4K | 2,100.00%286K | -208.33%-13K | 62.50%13K | ||||||
| Income before tax | -118.82%-8.18M | -70.92%12.78M | -48.12%21.45M | 403.52%159.83M | 165.68%31.07M | 247.30%43.47M | 869.12%43.94M | 1,279.61%41.35M | -14.04%31.74M | 146.81%11.69M |
| Income tax | -118.29%-963K | -92.02%930K | -58.23%3.19M | 1,941.49%27.6M | 717.04%3.04M | 1,780.36%5.27M | 677.12%11.65M | 11,483.33%7.65M | -78.22%1.35M | -125.22%-493K |
| Net income | -118.89%-7.22M | -63.31%11.85M | -45.83%18.26M | 335.10%132.23M | 129.97%28.03M | 212.22%38.21M | 963.95%32.29M | 1,049.85%33.7M | -1.07%30.39M | 337.91%12.19M |
| Net income continuous operations | -118.89%-7.22M | -63.31%11.85M | -45.83%18.26M | 335.10%132.23M | 129.97%28.03M | 212.22%38.21M | 963.95%32.29M | 1,049.85%33.7M | -1.07%30.39M | 337.91%12.19M |
| Noncontrolling interests | -182.87%-611K | 28.42%-209K | -263.46%-567K | -30.21%-1.42M | -51.41%-754K | -30.91%-216K | -60.44%-292K | 36.07%-156K | 83.51%-1.09M | 92.28%-498K |
| Net income attributable to the company | -117.20%-6.61M | -62.99%12.06M | -44.40%18.82M | 324.55%133.64M | 126.89%28.78M | 209.80%38.42M | 912.84%32.58M | 966.39%33.86M | -15.66%31.48M | 37.39%12.69M |
| Preferred stock dividends | ||||||||||
| Other under preferred stock dividend | 0 | 0 | 0 | 0 | 0 | 0 | 0 | 0 | 0 | 0 |
| Net income attributable to common stockholders | -117.20%-6.61M | -62.99%12.06M | -44.40%18.82M | 324.55%133.64M | 126.89%28.78M | 209.80%38.42M | 912.84%32.58M | 966.39%33.86M | -15.66%31.48M | 37.39%12.69M |
| Gross dividend payment | ||||||||||
| Basic earnings per share | -117.09%-0.047 | -63.09%0.086 | -44.90%0.135 | 322.27%0.967 | 126.09%0.208 | 205.56%0.275 | 913.04%0.233 | 965.22%0.245 | -15.81%0.229 | 37.31%0.092 |
| Diluted earnings per share | -117.60%-0.047 | -63.32%0.084 | -45.00%0.132 | 321.43%0.944 | 124.44%0.202 | 203.41%0.267 | 895.65%0.229 | 943.48%0.24 | -16.42%0.224 | 36.36%0.09 |
| Dividend per share | 0.0364 | 0 | 0 | 0.3487 | 0.3487 | |||||
| Accounting Standards | NonUS-GAAP | NonUS-GAAP | NonUS-GAAP | NonUS-GAAP | NonUS-GAAP | NonUS-GAAP | NonUS-GAAP | NonUS-GAAP | NonUS-GAAP | NonUS-GAAP |
FY: Financial Year. Refers to the 10-K file disclosed by the listed company to the SEC.
Q: Quarter. Refers to the 10-Q file disclosed by the listed company to the SEC. Q1, Q2, Q3, and Q4 are quarterly reports each with a span of 3 months; Q6 and Q9 are cumulative reports, with Q6 including 6 months and Q9 9 months.
