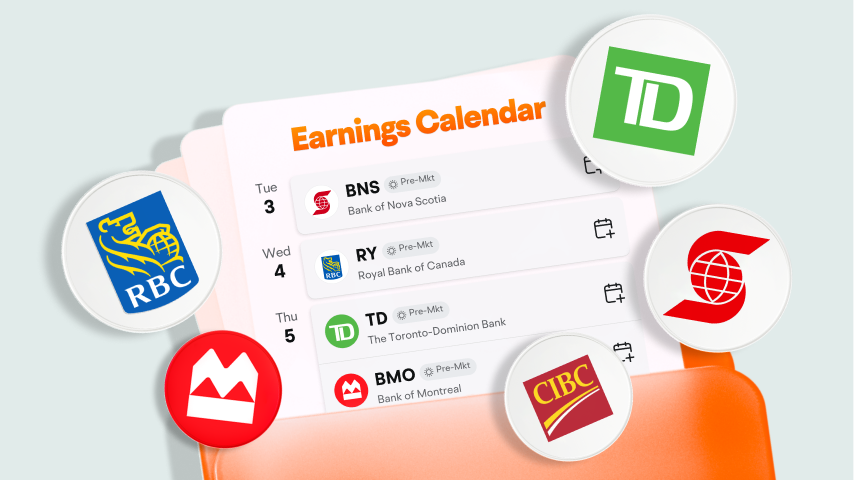
The Toronto-Dominion Bank
TD
Bank of Montreal
BMO
Royal Bank of Canada
RY
Canadian Imperial Bank of Commerce
CM
Bank of Nova Scotia
BNS
| (Q2)Jun 30, 2024 | (FY)Dec 31, 2023 | (Q4)Dec 31, 2023 | (Q2)Jun 30, 2023 | (FY)Dec 31, 2022 | (Q4)Dec 31, 2022 | (Q2)Jun 30, 2022 | (FY)Dec 31, 2021 | (Q4)Dec 31, 2021 | (Q2)Jun 30, 2021 | |
|---|---|---|---|---|---|---|---|---|---|---|
| Assets | ||||||||||
| Cash, cash equivalents and federal funds sold | -86.19%464.64K | -88.94%488.82K | -88.94%488.82K | -26.91%3.36M | 104.24%4.42M | 104.24%4.42M | 1,017.70%4.6M | -9.55%2.16M | -9.55%2.16M | -25.10%411.79K |
| -Cash and cash equivalents | -86.19%464.64K | -88.94%488.82K | -88.94%488.82K | -26.91%3.36M | 104.24%4.42M | 104.24%4.42M | 1,017.70%4.6M | -9.55%2.16M | -9.55%2.16M | -25.10%411.79K |
| -Available for sale securities | -4.35%89.92M | -11.19%89.11M | -11.19%89.11M | -3.15%94.01M | -0.92%100.34M | -0.92%100.34M | -2.72%97.07M | 7.26%101.27M | 7.26%101.27M | -0.32%99.79M |
| Receivables | -20.70%443.81K | 21.78%446.86K | 21.78%446.86K | 3.52%559.66K | -10.33%366.96K | -10.33%366.96K | 10.70%540.61K | -14.97%409.21K | -14.97%409.21K | -20.50%488.36K |
| Total assets | -7.25%90.83M | -14.35%90.04M | -14.35%90.04M | -4.19%97.93M | 1.23%105.12M | 1.23%105.12M | 1.51%102.21M | 6.74%103.84M | 6.74%103.84M | -0.58%100.69M |
| Liabilities | ||||||||||
| Payables | -7.80%2.66M | -7.67%2.75M | -7.67%2.75M | 1.35%2.89M | 1.33%2.98M | 1.33%2.98M | 4.89%2.85M | 4.89%2.94M | 4.89%2.94M | 2.69%2.72M |
| -Accounts payable | -7.80%2.66M | -7.67%2.75M | -7.67%2.75M | 1.35%2.89M | 1.33%2.98M | 1.33%2.98M | 4.89%2.85M | 4.89%2.94M | 4.89%2.94M | 2.69%2.72M |
| Long term debt and capital lease obligation | 5.50%19.03M | -23.00%17.64M | -23.00%17.64M | -17.11%18.04M | 7.56%22.9M | 7.56%22.9M | 4.21%21.76M | -0.87%21.29M | -0.87%21.29M | -9.02%20.88M |
| Total liabilities | 3.66%21.69M | -21.23%20.39M | -21.23%20.39M | -14.97%20.93M | 6.80%25.88M | 6.80%25.88M | 4.29%24.61M | -0.21%24.23M | -0.21%24.23M | -7.81%23.6M |
| Shareholders'equity | ||||||||||
| Total stockholders'equity | -10.22%69.13M | -12.10%69.66M | -12.10%69.66M | -0.77%77M | -0.46%79.24M | -0.46%79.24M | 0.66%77.6M | 9.05%79.61M | 9.05%79.61M | 1.87%77.09M |
| Total equity | -10.22%69.13M | -12.10%69.66M | -12.10%69.66M | -0.77%77M | -0.46%79.24M | -0.46%79.24M | 0.66%77.6M | 9.05%79.61M | 9.05%79.61M | 1.87%77.09M |
| Accounting Standards | US-GAAP | US-GAAP | US-GAAP | US-GAAP | US-GAAP | US-GAAP | US-GAAP | US-GAAP | US-GAAP | US-GAAP |
| Audit Opinions | -- | Unqualified Opinion | -- | -- | Unqualified Opinion | -- | -- | Unqualified Opinion | -- | -- |
FY: Financial Year. Refers to the 10-K file disclosed by the listed company to the SEC.
Q: Quarter. Refers to the 10-Q file disclosed by the listed company to the SEC. Q1, Q2, Q3, and Q4 are quarterly reports each with a span of 3 months; Q6 and Q9 are cumulative reports, with Q6 including 6 months and Q9 9 months.
