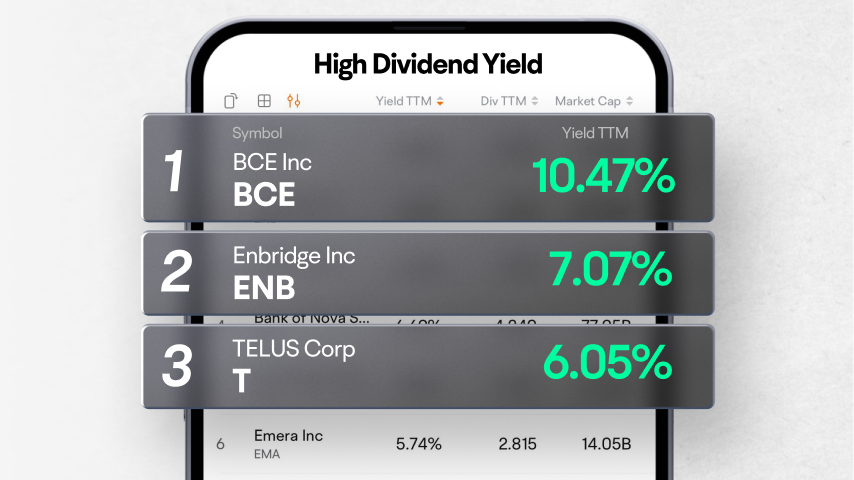
Brookfield Renewable Partners LP
BEP.UN
Emera Inc
EMA
Bank of Nova Scotia
BNS
Choice Properties Real Estate Investment Trust
CHP.UN
Enbridge Inc
ENB
| (Q3)Sep 30, 2024 | (Q2)Jun 30, 2024 | (Q1)Mar 31, 2024 | (FY)Dec 31, 2023 | (Q4)Dec 31, 2023 | (Q3)Sep 30, 2023 | (Q2)Jun 30, 2023 | (Q1)Mar 31, 2023 | (FY)Dec 31, 2022 | (Q4)Dec 31, 2022 | |
|---|---|---|---|---|---|---|---|---|---|---|
| Operating Cash Flow (Indirect Method) | ||||||||||
| Cash flow from continuing operating activities | 145.14%18.25K | 197.41%1.43K | 541.92%9.3K | 128.94%27.55K | 1,469.96%71.55K | -164.89%-40.43K | 92.54%-1.47K | 96.18%-2.1K | -168.97%-95.19K | 84.50%-5.22K |
| Net income from continuing operations | 156.36%19.62K | 43.16%13.12K | 1,221.22%5.85K | 160.10%33.5K | 342.89%58.71K | -603.29%-34.81K | 149.37%9.16K | 105.49%443 | 76.77%-55.74K | 87.35%-24.17K |
| Change In working capital | 75.57%-1.37K | -9.94%-11.69K | 235.26%3.45K | 84.91%-5.95K | -32.23%12.84K | 45.53%-5.62K | -843.96%-10.63K | 94.58%-2.55K | ---39.44K | 187.71%18.95K |
| -Change in payables and accrued expense | 75.57%-1.37K | -9.94%-11.69K | 235.26%3.45K | 84.91%-5.95K | -32.23%12.84K | 45.53%-5.62K | -843.96%-10.63K | 94.58%-2.55K | ---39.44K | 151.77%18.95K |
| Cash from discontinued investing activities | ||||||||||
| Operating cash flow | 145.14%18.25K | 197.41%1.43K | 541.92%9.3K | 128.94%27.55K | 1,469.96%71.55K | -164.89%-40.43K | 92.54%-1.47K | 96.18%-2.1K | -168.97%-95.19K | 84.50%-5.22K |
| Investing cash flow | ||||||||||
| Cash flow from continuing investing activities | ||||||||||
| Cash from discontinued investing activities | ||||||||||
| Financing cash flow | ||||||||||
| Cash flow from continuing financing activities | ||||||||||
| Cash from discontinued financing activities | ||||||||||
| Net cash flow | ||||||||||
| Beginning cash position | 2.18%1.96M | 2.03%1.96M | 1.43%1.95M | -4.71%1.92M | 0.23%1.93M | -1.24%1.92M | -2.15%1.92M | -4.71%1.92M | --2.02M | 642.86%1.93M |
| Current changes in cash | 38.69%18.25K | 197.41%1.43K | 541.92%9.3K | 128.94%27.55K | 443.96%17.97K | 186.21%13.16K | 92.54%-1.47K | 96.18%-2.1K | -104.71%-95.19K | -100.30%-5.22K |
| End cash Position | 2.43%1.98M | 2.18%1.96M | 2.03%1.96M | 1.43%1.95M | 1.43%1.95M | 0.23%1.93M | -1.24%1.92M | -2.15%1.92M | -4.71%1.92M | -4.71%1.92M |
| Free cash from | 145.14%18.25K | 197.41%1.43K | 541.92%9.3K | 128.94%27.55K | 1,469.96%71.55K | -164.89%-40.43K | 92.54%-1.47K | 96.18%-2.1K | -168.97%-95.19K | 84.50%-5.22K |
| Accounting Standards | US-GAAP | US-GAAP | US-GAAP | US-GAAP | US-GAAP | US-GAAP | US-GAAP | US-GAAP | US-GAAP | US-GAAP |
| Audit Opinions | -- | -- | -- | Unqualified Opinion | -- | -- | -- | -- | -- | -- |
FY: Financial Year. Refers to the 10-K file disclosed by the listed company to the SEC.
Q: Quarter. Refers to the 10-Q file disclosed by the listed company to the SEC. Q1, Q2, Q3, and Q4 are quarterly reports each with a span of 3 months; Q6 and Q9 are cumulative reports, with Q6 including 6 months and Q9 9 months.
