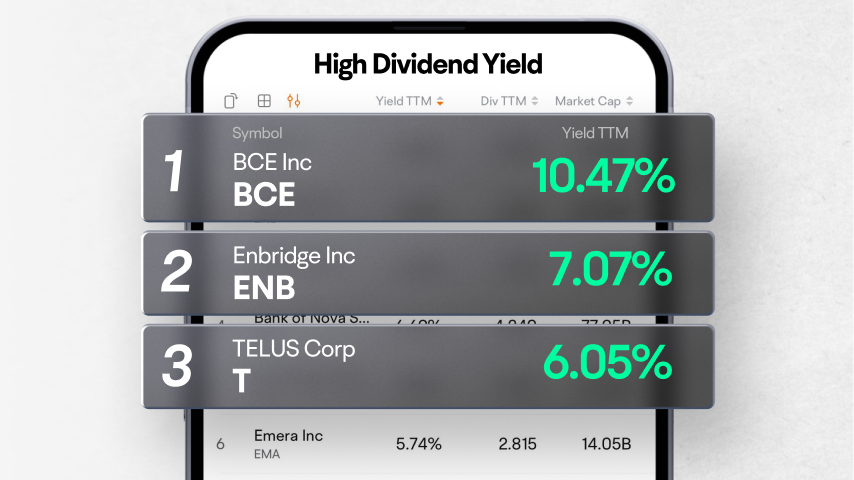
Enbridge Inc
ENB
TC Energy Corp
TRP
TELUS Corp
T
The Toronto-Dominion Bank
TD
BCE Inc
BCE
| (Q3)Aug 31, 2024 | (Q2)May 31, 2024 | (Q1)Feb 29, 2024 | (FY)Nov 30, 2023 | (Q4)Nov 30, 2023 | (Q3)Aug 31, 2023 | (Q2)May 31, 2023 | (Q1)Feb 28, 2023 | (FY)Nov 30, 2022 | (Q4)Nov 30, 2022 | |
|---|---|---|---|---|---|---|---|---|---|---|
| Operating Cash Flow (Indirect Method) | ||||||||||
| Cash flow from continuing operating activities | 48.18%-96.54K | 91.41%-9.98K | 67.30%-88.63K | 8.33%-702.29K | -180.96%-128.83K | 62.81%-186.29K | 22.22%-116.16K | 1.43%-271.01K | -38.31%-766.13K | 176.82%159.12K |
| Net income from continuing operations | 54.89%-129.13K | 16.07%-162.59K | -367.96%-222.22K | -66.91%-2.65M | -951.52%-2.12M | 48.06%-286.24K | 64.85%-193.71K | 83.17%-47.49K | -425.00%-1.59M | -165.74%-201.56K |
| Operating gains losses | --0 | -29.32%95.52K | 80.06%-28.01K | 57,385.19%1.83M | --1.84M | --0 | 576.54%135.14K | -658.31%-140.46K | 90.18%-3.2K | --0 |
| Unrealized gains and losses of investment securities | --0 | ---- | ---- | -138.50%-184.64K | -579.72%-133.96K | -74.68%56.31K | ---- | ---- | 828.85%479.58K | -167.60%-19.71K |
| Remuneration paid in stock | -86.64%23.14K | --70.06K | --73.08K | 9.66%251.45K | 313.99%78.34K | 224.16%173.1K | --0 | --0 | 83.45%229.29K | -129.29%-36.61K |
| Deferred tax | ---- | ---- | ---- | 39.61%263.47K | ---- | ---- | ---- | ---- | 129.72%188.72K | ---- |
| Other non cashItems | ---- | ---- | ---- | ---331.7K | ---204.32K | ---112.5K | ---7.88K | ---7.01K | ---- | ---- |
| Change In working capital | 155.76%9.46K | 56.34%89.55K | 216.38%88.52K | 251.27%112.92K | -45.80%148.66K | 93.76%-16.96K | 156.34%57.28K | 23.67%-76.06K | -117.22%-74.65K | 18.36%274.27K |
| -Change in receivables | 82.17%-11.32K | 150.85%15.58K | 1,383.37%111.49K | -815.01%-109.97K | -324.83%-60.2K | -63.83%-63.5K | -42.88%6.21K | -54.42%7.52K | -63.33%15.38K | 18.23%26.77K |
| -Change in prepaid assets | -36.07%12.98K | -90.75%9.14K | 210.92%93.76K | 171.31%60.82K | -90.35%26.27K | 108.29%20.31K | 86.10%98.76K | 48.97%-84.53K | -1,493.94%-85.28K | 405.45%272.25K |
| -Change in payables and accrued expense | -70.26%7.8K | 235.94%64.83K | -12,374.55%-116.73K | 3,516.34%162.07K | 837.58%182.58K | 116.67%26.23K | -14.65%-47.69K | -98.08%951 | 94.24%-4.74K | -115.95%-24.75K |
| Cash from discontinued investing activities | ||||||||||
| Operating cash flow | 48.18%-96.54K | 91.41%-9.98K | 67.30%-88.63K | 8.33%-702.29K | -180.96%-128.83K | 62.81%-186.29K | 22.22%-116.16K | 1.43%-271.01K | -38.31%-766.13K | 176.82%159.12K |
| Investing cash flow | ||||||||||
| Cash flow from continuing investing activities | 85.90%-172.51K | 104.22%14.07K | -32.59%-295.01K | -74.31%-3.87M | -558.63%-2.09M | -0.83%-1.22M | -85.66%-333.47K | 56.21%-222.49K | 12.87%-2.22M | 65.32%-316.77K |
| Net PPE purchase and sale | 85.76%-172.1K | 93.71%-20.98K | -87.54%-417.13K | -80.11%-3.98M | -605.46%-2.22M | 0.36%-1.21M | -66.05%-333.45K | 53.87%-222.43K | 15.39%-2.21M | 65.60%-314.2K |
| Net investment purchase and sale | --0 | --35.05K | --122.5K | 524.49%132.39K | --132.39K | --0 | --0 | --0 | -72.67%21.2K | --0 |
| Net other investing changes | 97.18%-408 | --0 | -495.24%-375 | 40.88%-16.82K | 12.72%-2.25K | ---14.49K | ---16 | 99.76%-63 | -174.87%-28.46K | ---2.58K |
| Cash from discontinued investing activities | ||||||||||
| Investing cash flow | 85.90%-172.51K | 104.22%14.07K | -32.59%-295.01K | -74.31%-3.87M | -558.63%-2.09M | -0.83%-1.22M | -85.66%-333.47K | 56.21%-222.49K | 12.87%-2.22M | 65.32%-316.77K |
| Financing cash flow | ||||||||||
| Cash flow from continuing financing activities | -70.23%121.87K | -85.30%215.54K | -81.62%282.7K | 44.04%4.46M | 1.05M | -76.20%409.33K | 5,871.09%1.47M | 13.58%1.54M | 121,525.16%3.1M | 0 |
| Net common stock issuance | -16.48%341.87K | -100.30%-4.46K | -81.62%282.7K | 44.04%4.46M | --1.05M | -76.20%409.33K | 5,871.09%1.47M | 13.58%1.54M | 121,525.16%3.1M | --0 |
| Cash from discontinued financing activities | ||||||||||
| Financing cash flow | -70.23%121.87K | -85.30%215.54K | -81.62%282.7K | 44.04%4.46M | --1.05M | -76.20%409.33K | 5,871.09%1.47M | 13.58%1.54M | 121,525.16%3.1M | --0 |
| Net cash flow | ||||||||||
| Beginning cash position | -86.44%321.05K | -92.50%101.42K | -34.01%202.35K | 60.06%306.63K | 194.64%1.37M | 416.55%2.37M | 77.14%1.35M | 60.06%306.63K | -94.17%191.57K | -55.68%464.28K |
| Current changes in cash | 85.29%-147.17K | -78.40%219.63K | -109.66%-100.94K | -190.63%-104.27K | -639.35%-1.17M | -17,396.23%-1M | 434.11%1.02M | 82.86%1.04M | 103.72%115.06K | 81.58%-157.65K |
| End cash Position | -87.29%173.87K | -86.44%321.05K | -92.50%101.42K | -34.01%202.35K | -34.01%202.35K | 194.64%1.37M | 416.55%2.37M | 77.14%1.35M | 60.06%306.63K | 60.06%306.63K |
| Free cash from | 80.75%-268.64K | 93.11%-30.96K | -2.50%-505.76K | -57.34%-4.68M | -1,412.43%-2.35M | 18.61%-1.4M | -28.40%-449.6K | 34.83%-493.44K | 5.99%-2.98M | 81.88%-155.07K |
| Accounting Standards | US-GAAP | US-GAAP | US-GAAP | US-GAAP | US-GAAP | US-GAAP | US-GAAP | US-GAAP | US-GAAP | US-GAAP |
| Audit Opinions | -- | -- | -- | Unqualified Opinion with Explanatory Notes | -- | -- | -- | -- | Unqualified Opinion with Explanatory Notes | -- |
FY: Financial Year. Refers to the 10-K file disclosed by the listed company to the SEC.
Q: Quarter. Refers to the 10-Q file disclosed by the listed company to the SEC. Q1, Q2, Q3, and Q4 are quarterly reports each with a span of 3 months; Q6 and Q9 are cumulative reports, with Q6 including 6 months and Q9 9 months.
