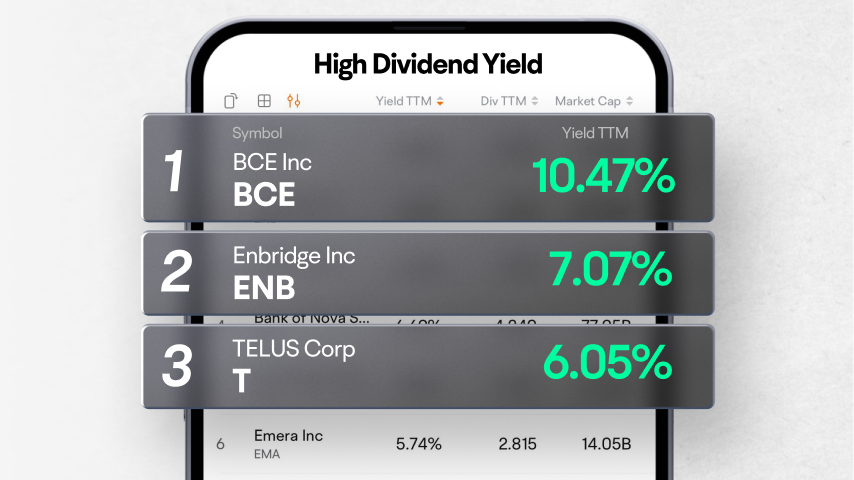
Enbridge Inc
ENB
Choice Properties Real Estate Investment Trust
CHP.UN
Brookfield Renewable Partners LP
BEP.UN
The Toronto-Dominion Bank
TD
TC Energy Corp
TRP
| (Q2)Jun 30, 2024 | (Q1)Mar 31, 2024 | (FY)Dec 31, 2023 | (Q4)Dec 31, 2023 | (Q3)Sep 30, 2023 | (Q2)Jun 30, 2023 | (Q1)Mar 31, 2023 | (FY)Dec 31, 2022 | (Q4)Dec 31, 2022 | (Q3)Sep 30, 2022 | |
|---|---|---|---|---|---|---|---|---|---|---|
| Assets | ||||||||||
| Current assets | ||||||||||
| Cash, cash equivalents and short term investments | -69.68%9.37K | -70.46%10.46K | -91.57%3.52K | -91.57%3.52K | -60.83%19.52K | -39.24%30.9K | -61.77%35.4K | -55.31%41.73K | -55.31%41.73K | -47.77%49.83K |
| -Cash and cash equivalents | -69.68%9.37K | -70.46%10.46K | -91.57%3.52K | -91.57%3.52K | -60.83%19.52K | -39.24%30.9K | -61.77%35.4K | -55.31%41.73K | -55.31%41.73K | -47.77%49.83K |
| Prepaid assets | 0.00%2.26K | 0.00%2.26K | 0.00%2.26K | 0.00%2.26K | 0.00%2.26K | 0.00%2.26K | 0.00%2.26K | 0.00%2.26K | 0.00%2.26K | 0.00%2.26K |
| Total current assets | -64.93%11.63K | -66.23%12.72K | -86.87%5.78K | -86.87%5.78K | -58.19%21.78K | -37.57%33.16K | -60.30%37.66K | -54.00%43.99K | -54.00%43.99K | -46.67%52.09K |
| Non current assets | ||||||||||
| Total non current assets | --0 | --0 | --0 | --0 | --0 | --0 | --0 | --0 | --0 | --0 |
| Total assets | -64.93%11.63K | -66.23%12.72K | -86.87%5.78K | -86.87%5.78K | -58.19%21.78K | -37.57%33.16K | -60.30%37.66K | -54.00%43.99K | -54.00%43.99K | -46.67%52.09K |
| Liabilities | ||||||||||
| Current liabilities | ||||||||||
| Current deferred liabilities | --17.52K | --15K | ---- | ---- | ---- | ---- | ---- | ---- | ---- | ---- |
| Current liabilities | 17.30%112.81K | 49.56%95.57K | 29.36%80.57K | 29.36%80.57K | 105.15%132.61K | 62.29%96.17K | -22.77%63.9K | 2.54%62.28K | 2.54%62.28K | 121.65%64.64K |
| Non current liabilities | ||||||||||
| Total non current liabilities | --0 | --0 | --0 | --0 | --0 | --0 | --0 | --0 | --0 | --0 |
| Total liabilities | 17.30%112.81K | 49.56%95.57K | 29.36%80.57K | 29.36%80.57K | 105.15%132.61K | 62.29%96.17K | -22.77%63.9K | 2.54%62.28K | 2.54%62.28K | 121.65%64.64K |
| Shareholders'equity | ||||||||||
| Share capital | 0.00%347.66K | 0.00%347.66K | 0.00%347.66K | 0.00%347.66K | 0.00%347.66K | 0.00%347.66K | 0.00%347.66K | 0.00%347.66K | 0.00%347.66K | 0.00%347.66K |
| -common stock | 0.00%347.66K | 0.00%347.66K | 0.00%347.66K | 0.00%347.66K | 0.00%347.66K | 0.00%347.66K | 0.00%347.66K | 0.00%347.66K | 0.00%347.66K | 0.00%347.66K |
| Additional paid-in capital | 0.00%56.99K | 0.00%56.99K | 0.00%56.99K | 0.00%56.99K | 0.00%56.99K | 0.00%56.99K | 0.00%56.99K | 0.00%56.99K | 0.00%56.99K | 0.00%56.99K |
| Retained earnings | -8.16%-505.83K | -13.14%-487.5K | -13.36%-479.44K | -13.36%-479.44K | -23.56%-515.49K | -13.84%-467.66K | -9.77%-430.89K | -14.39%-422.94K | -14.39%-422.94K | -24.11%-417.21K |
| Total stockholders'equity | -60.57%-101.18K | -215.74%-82.85K | -308.88%-74.79K | -308.88%-74.79K | -782.72%-110.83K | -925.05%-63.01K | -316.73%-26.24K | -152.41%-18.29K | -152.41%-18.29K | -118.33%-12.56K |
| Total equity | -60.57%-101.18K | -215.74%-82.85K | -308.88%-74.79K | -308.88%-74.79K | -782.72%-110.83K | -925.05%-63.01K | -316.73%-26.24K | -152.41%-18.29K | -152.41%-18.29K | -118.33%-12.56K |
| Accounting Standards | US-GAAP | US-GAAP | US-GAAP | US-GAAP | US-GAAP | US-GAAP | US-GAAP | US-GAAP | US-GAAP | US-GAAP |
| Audit Opinions | -- | -- | Unqualified Opinion with Explanatory Notes | -- | -- | -- | -- | Unqualified Opinion with Explanatory Notes | -- | -- |
FY: Financial Year. Refers to the 10-K file disclosed by the listed company to the SEC.
Q: Quarter. Refers to the 10-Q file disclosed by the listed company to the SEC. Q1, Q2, Q3, and Q4 are quarterly reports each with a span of 3 months; Q6 and Q9 are cumulative reports, with Q6 including 6 months and Q9 9 months.
