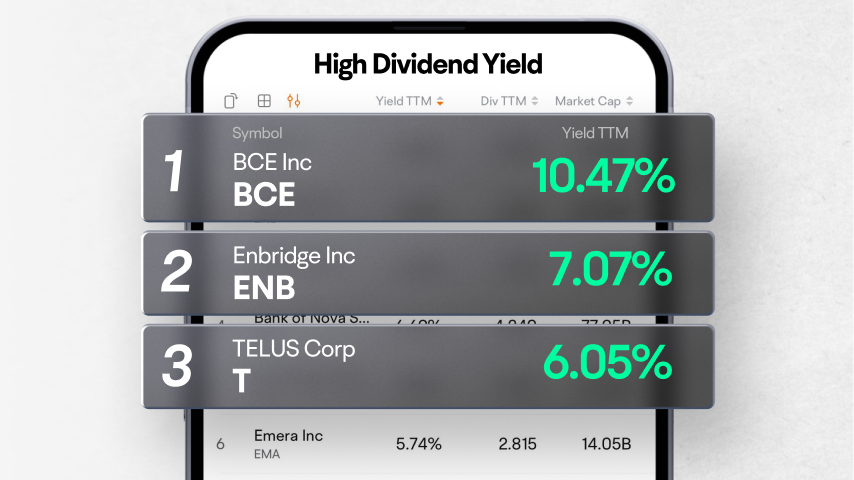
Enbridge Inc
ENB
TC Energy Corp
TRP
Choice Properties Real Estate Investment Trust
CHP.UN
TELUS Corp
T
Emera Inc
EMA
| (Q3)Sep 30, 2024 | (Q2)Jun 30, 2024 | (Q1)Mar 31, 2024 | (FY)Dec 31, 2023 | (Q4)Dec 31, 2023 | (Q3)Sep 30, 2023 | (Q2)Jun 30, 2023 | (Q1)Mar 31, 2023 | (FY)Dec 31, 2022 | (Q4)Dec 31, 2022 | |
|---|---|---|---|---|---|---|---|---|---|---|
| Operating Cash Flow (Indirect Method) | ||||||||||
| Cash flow from continuing operating activities | 32.91%-105.94K | 39.30%-136.23K | -7.02%-118.4K | -22.62%-660.04K | -39.88%-167.1K | -14.13%-157.9K | -25.69%-224.42K | -8.53%-110.63K | -13.25%-538.29K | 29.37%-119.46K |
| Net income from continuing operations | -26.35%-354.4K | 28.24%-194.05K | -33.95%-208.6K | 17.15%-987.34K | 71.53%-280.71K | 13.97%-280.49K | -146.34%-270.41K | 66.39%-155.73K | -127.80%-1.19M | -136.78%-985.85K |
| Operating gains losses | -31.79%53.75K | -87.89%5K | 767.21%41.02K | 104.97%57.91K | -19.47%-56.03K | -31.17%78.8K | 103.00%41.28K | -104.24%-6.15K | 76.38%-1.17M | 98.40%-46.9K |
| Asset impairment expenditure | 330.76%177.05K | -2.13%58.98K | 87.39%5.97K | -81.15%263.01K | -81.04%158.46K | 267.20%41.1K | -89.00%60.26K | --3.19K | 5,637.72%1.4M | 3,337.95%835.87K |
| Remuneration paid in stock | --0 | --0 | 53.53%5.94K | -93.14%26.52K | -76.52%7.75K | -90.19%6.97K | -91.60%7.94K | -97.94%3.87K | 265.07%386.48K | -45.33%33.02K |
| Other non cashItems | -105.87%-728 | 48.15%-643 | 42.36%-1.16K | -16.73%23.55K | 292.56%14.4K | 0.30%12.41K | -123.19%-1.24K | -129.22%-2.02K | -28.92%28.29K | -69.25%3.67K |
| Change In working capital | 210.25%18.4K | 91.15%-5.51K | -16.82%38.44K | -575.25%-43.69K | -126.91%-10.97K | 21.90%-16.69K | -95.73%-62.25K | 113.75%46.21K | 257.43%9.19K | 730.32%40.74K |
| -Change in receivables | -265.28%-17.29K | 144.42%14.36K | -23.12%23.87K | -3,920.00%-40.8K | -532.49%-34.78K | -200.66%-4.73K | -60.20%-32.33K | 383.22%31.04K | 90.26%-1.02K | 123.69%8.04K |
| -Change in payables and accrued expense | 398.45%35.68K | 33.57%-19.87K | -3.93%14.58K | -128.28%-2.89K | -27.17%23.82K | 54.14%-11.96K | -157.41%-29.92K | -0.16%15.17K | -21.40%10.21K | 18.99%32.7K |
| Cash from discontinued investing activities | ||||||||||
| Operating cash flow | 32.91%-105.94K | 39.30%-136.23K | -7.02%-118.4K | -22.62%-660.04K | -39.88%-167.1K | -14.13%-157.9K | -25.69%-224.42K | -8.53%-110.63K | -13.25%-538.29K | 29.37%-119.46K |
| Investing cash flow | ||||||||||
| Cash flow from continuing investing activities | 143.45%68.5K | -124.26%-129.46K | 500.68%157.63K | 1.88%-210.41K | 358.39%44.29K | 3.60%-157.64K | -148.29%-57.73K | -273.26%-39.34K | -271.24%-214.45K | 32.91%-17.14K |
| Net PPE purchase and sale | 132.05%25.64K | -864.23%-119.14K | 211.17%8.33K | 16.26%-35.24K | 27.21%36.66K | 20.58%-80K | 1,927.55%15.59K | -124.42%-7.49K | -117.16%-42.08K | 92.06%28.82K |
| Net investment purchase and sale | 237.04%50K | --0 | --155.37K | -41.35%14.84K | --0 | --14.84K | --0 | --0 | -82.32%25.3K | -96.49%1.91K |
| Interest received (cash flow from investment activities) | -47.36%728 | -87.66%643 | -46.53%1.16K | 87.80%9.37K | -53.12%608 | -25.61%1.38K | 183.87%5.21K | --2.17K | 2,446.43%4.99K | 129,600.00%1.3K |
| Net other investing changes | 91.62%-7.87K | 86.04%-10.97K | 78.77%-7.22K | 1.61%-199.38K | 114.28%7.02K | -45.18%-93.85K | -224.05%-78.53K | 47.34%-34.02K | 23.04%-202.65K | 48.20%-49.17K |
| Cash from discontinued investing activities | ||||||||||
| Investing cash flow | 143.45%68.5K | -124.26%-129.46K | 500.68%157.63K | 1.88%-210.41K | 358.39%44.29K | 3.60%-157.64K | -148.29%-57.73K | -273.26%-39.34K | -271.24%-214.45K | 32.91%-17.14K |
| Financing cash flow | ||||||||||
| Cash flow from continuing financing activities | 50.82%64.85K | 3,791.73%166.13K | -93.91%36.4K | 17.53%672.44K | 900.00%36K | 407.14%43K | -100.76%-4.5K | 597.94K | 2.44%572.12K | 0.00%-4.5K |
| Net issuance payments of debt | --0 | --0 | ---3K | -33.33%-18K | -100.00%-9K | 0.00%-4.5K | ---4.5K | --0 | 25.00%-13.5K | 0.00%-4.5K |
| Net common stock issuance | --239.28K | --0 | -93.50%40K | 16.29%697.75K | --82.5K | --0 | --0 | --615.25K | 3.00%600K | --0 |
| Net other financing activities | -467.22%-174.43K | --166.13K | 96.53%-600 | 49.12%-7.32K | ---37.5K | 600.00%47.5K | --0 | ---17.32K | -139.63%-14.38K | --0 |
| Cash from discontinued financing activities | ||||||||||
| Financing cash flow | 50.82%64.85K | 3,791.73%166.13K | -93.91%36.4K | 17.53%672.44K | 900.00%36K | 407.14%43K | -100.76%-4.5K | --597.94K | 2.44%572.12K | 0.00%-4.5K |
| Net cash flow | ||||||||||
| Beginning cash position | -90.24%41.47K | -80.18%141.03K | -75.18%65.39K | -40.68%263.41K | -62.38%152.19K | -41.04%424.73K | 114.56%711.38K | -40.68%263.41K | 88.46%444.02K | -37.11%404.51K |
| Current changes in cash | 110.06%27.42K | 65.27%-99.56K | -83.12%75.64K | -9.64%-198.02K | 38.48%-86.81K | 13.72%-272.54K | -173.72%-286.64K | 498.30%447.97K | -186.66%-180.61K | 29.16%-141.1K |
| End cash Position | -54.74%68.89K | -90.24%41.47K | -80.18%141.03K | -75.18%65.39K | -75.18%65.39K | -62.38%152.19K | -41.04%424.73K | 114.56%711.38K | -40.68%263.41K | -40.68%263.41K |
| Free cash from | 55.41%-127.19K | -7.68%-255.36K | -4.52%-123.46K | -20.25%-812.58K | -41.62%-172.08K | -11.49%-285.23K | -32.19%-237.16K | 0.74%-118.12K | -14.53%-675.74K | 40.01%-121.51K |
| Accounting Standards | US-GAAP | US-GAAP | US-GAAP | US-GAAP | US-GAAP | US-GAAP | US-GAAP | US-GAAP | US-GAAP | US-GAAP |
| Audit Opinions | -- | -- | -- | Unqualified Opinion with Explanatory Notes | -- | -- | -- | -- | Unqualified Opinion with Explanatory Notes | -- |
FY: Financial Year. Refers to the 10-K file disclosed by the listed company to the SEC.
Q: Quarter. Refers to the 10-Q file disclosed by the listed company to the SEC. Q1, Q2, Q3, and Q4 are quarterly reports each with a span of 3 months; Q6 and Q9 are cumulative reports, with Q6 including 6 months and Q9 9 months.
