How to interpret the "short sale analysis" chart?
1. What is a short sale?
A short sale occurs when investors first borrow a large number of securities and sell them at a high price in the market; when the price of the securities falls in the future, they buy back the securities at a lower price and return the borrowed securities. Profits are thus made.
2. How to use short sale data to assist investment decisions?
2.1 Usage scenario
Short sale data is one of the important indicators for stock analysis, which can assist investors in understanding the market sentiment and future performance of a certain stock. Investors who like to go long can track short-selling data and avoid stocks whose stock prices may have a downward trend; those who are interested in short sale can find stocks with a high short-selling ratio and thus investment opportunities.
2.2 Understand the short sale data indicators
Daily short sale quantity: The daily number of shares that are sold short on the open market.
* The daily short sale data of Hong Kong stocks is provided by the Hong Kong Stock Exchange and is generally updated once a day.
* The daily short sale data of US stocks is provided by the New York Stock Exchange and the Nasdaq Stock Exchange, and is generally updated once a day.
The formula for short-sale ratio:
Short Sale Ratio = Short Sale Volume / Total Volume
Short interest: the number of shares of the stock that have been sold short and remain unclosed as of the last update.
* The short position data of HK stocks is provided by the Securities and Futures Commission of Hong Kong and is generally updated once a week.
* The short position data of US stocks is provided by the exchanges and usually updated every half a month.
The formulae related to short positions:
HK Stock Short Interest Ratio = Short Interest / Shares Floating
US Stock Short Interest Ratio = Short Interest / Shares Outstanding
Days to Cover = Short Interest / 30-Day Average Daily Trading Volume
2.3 Judge market sentiment and assist decision-making by analyzing short sale data
● The volume of short sale reflects investors' overall judgment on the price trend of a certain stock
For stocks with a large short sale volume, investors are generally bearish on the stock price outlook. If a stock's short sale volume rises sharply, the stock price is likely to experience a short-term decline.
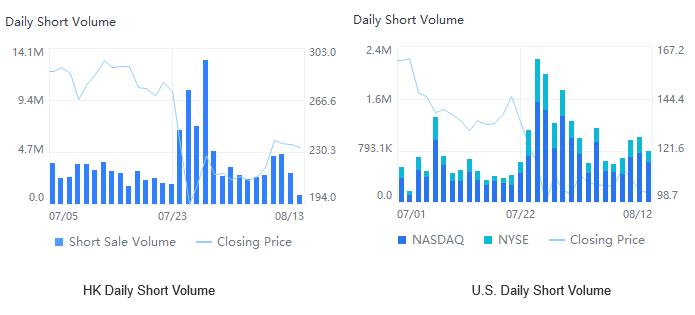
In addition to the short sale volume, we can supplement our analysis with the short sale ratio. If the short sale volume increases while the short sale ratio does not change much, the increase may not be a significant indicator. If the short sale ratio continues to rise, the chances for the stock price to fall will be greater.
● Changes in short interest and short interest ratio are important indicators of the market's bearish sentiment and possible stock price changes
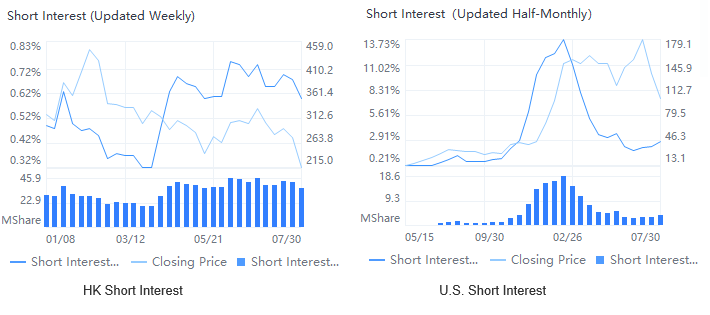
A significant short interest means that currently bears are attacking the stock price, and the possibility for the stock price to fall is higher; on the contrary, a sharp decrease in short interest means that the short sellers are buying stocks to close positions, which may further stimulate the stock price to rise.
The stock price trend is negatively correlated with the short interest ratio. However, the correlation is not absolute, as there are many factors that affect the stock price and it is not possible to judge the stock price trend by only relying on a single indicator. If a stock's short interest ratio is too high and the stock price substantially rises due to various factors, the short sellers have to buy back stocks at a high price. A short squeeze will thus occur.
3. How to view the daily short sale data?
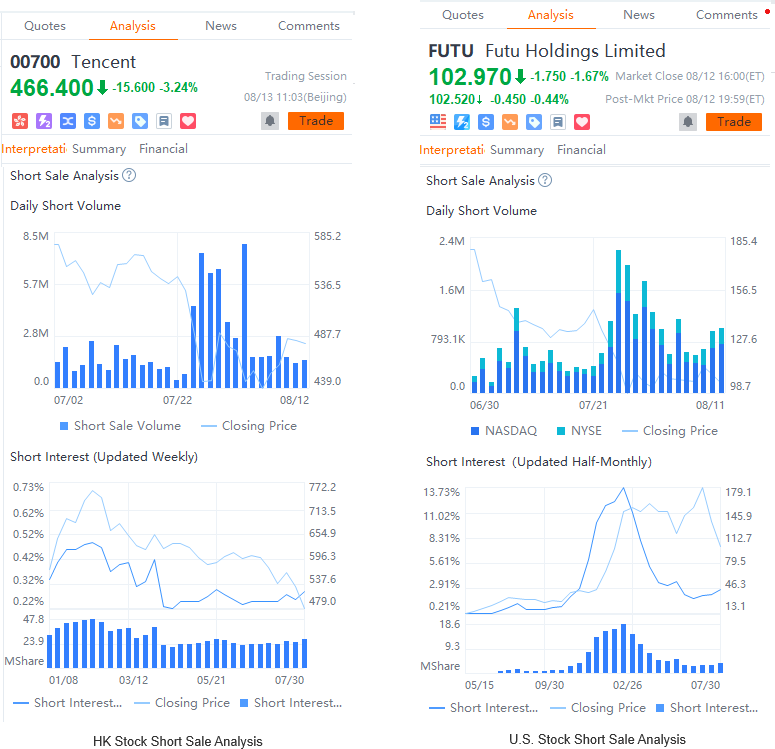
3.1 Path: In the summary column on the right side of a HK or US stock, click the "Analysis" tab, and select "Interpretation". You can view the daily short sale and short interest data of a certain stock under "Short Sale Data Analysis".
3.2 Click on the chart to view the total trading volume of a certain trading day and the short sale ratio.
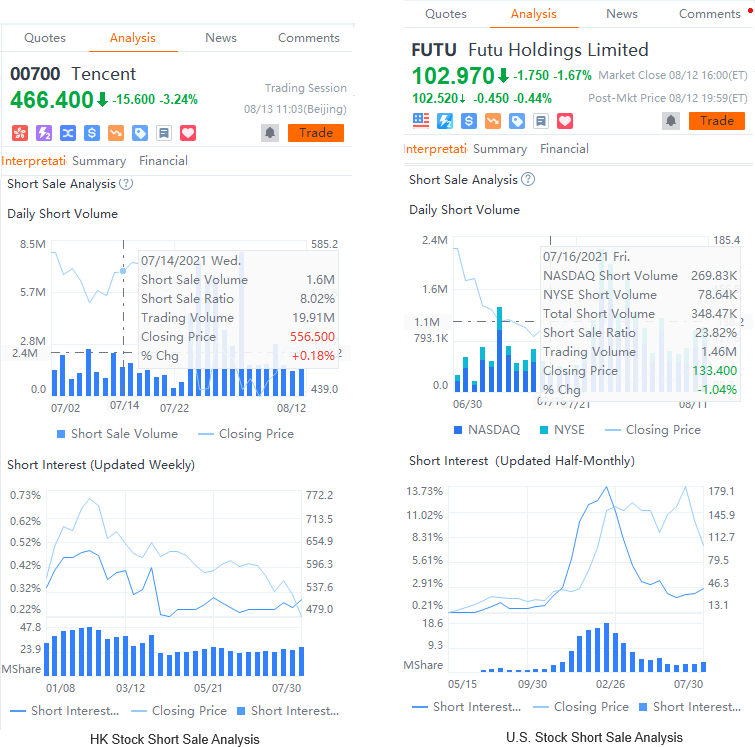
3.3 Moomoo also provides data on short interest of the stock. Click on the chart to view the short interest and short interest ratio of a certain trading day.
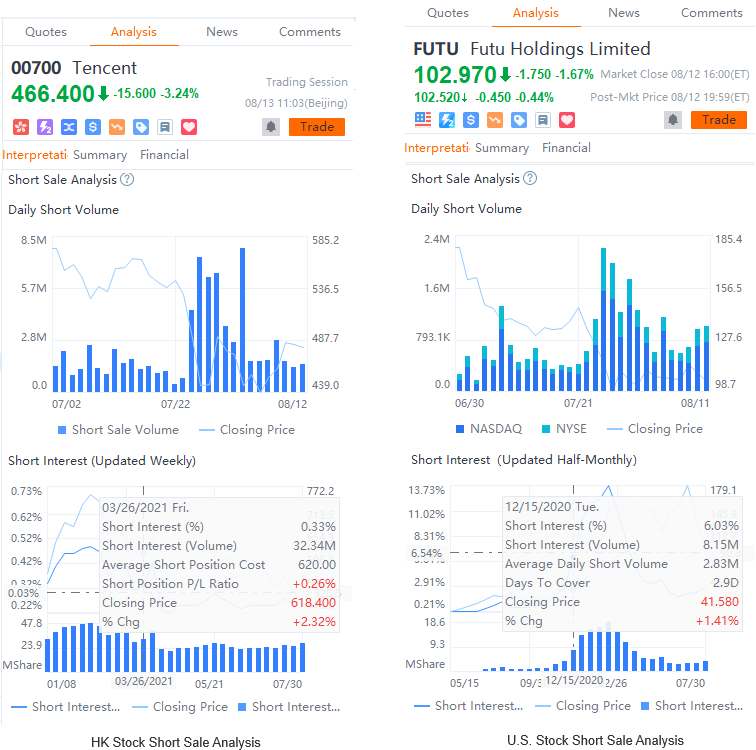
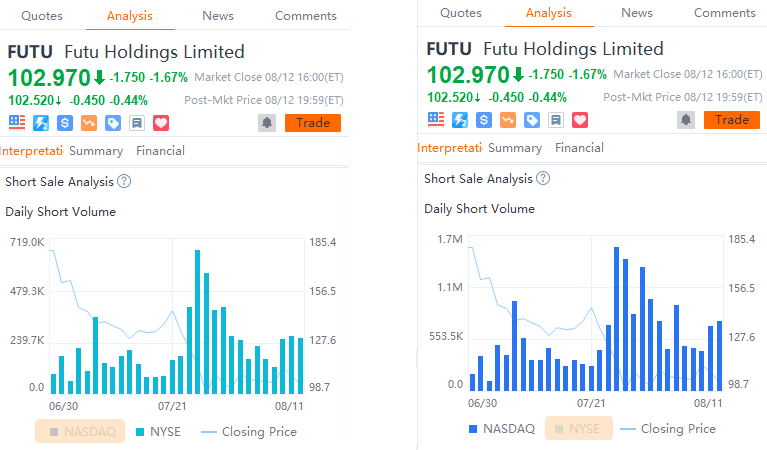
3.4 At the bottom of the daily short sale data chart of US stocks, click "Nasdaq" to hide relevant data and only view a stock's short sale trend on the NYSE and its affiliates; likewise, click "NYSE" to only view a stock's short sale trend on the Nasdaq and all its affiliates.
Risk Disclosure This presentation is for informational and educational use only and is not a recommendation or endorsement of any particular investment or investment strategy. Investment information provided in this content is general in nature, strictly for illustrative purposes, and may not be appropriate for all investors. It is provided without respect to individual investors’ financial sophistication, financial situation, investment objectives, investing time horizon, or risk tolerance. You should consider the appropriateness of this information having regard to your relevant personal circumstances before making any investment decisions. Past investment performance does not indicate or guarantee future success. Returns will vary, and all investments carry risks, including loss of principal. Moomoo makes no representation or warranty as to its adequacy, completeness, accuracy or timeliness for any particular purpose of the above content.
Overview
- No more -